Debugging and Performance Analysis
Tools that access hardware counters on the AMD CPU, NVIDIA GPU, or AMD GPU need to add an additional Slurm directive.
For CPU jobs, add
--constraint=perf# implies whole nodes, exclusive accessFor GPU jobs, add
--constraint=perf,nvperf
See below for use cases and sample job script excerpts.
AMDuProf Guide
Run and Collect Data
Run a batch job and collect data:
...
#SBATCH --constraint=perf  # perf,nvperf for gpu nodes

cd $SLURM_SUBMIT_DIR
export PATH=/sw/external/amd/AMDuProf_Linux_x64_4.0.341/bin:$PATH

set -v
srun AMDuProfCLI collect --config tbp  -o `pwd`/uprof_tbp  `pwd`/stream.22gb
srun AMDuProfCLI collect --config inst_access  -o `pwd`/uprof_inst_access  `pwd`/stream.22gb
srun AMDuProfCLI collect --config assess  -o `pwd`/uprof_assess  `pwd`/stream.22gb
srun AMDuProfCLI collect --config assess_ext  -o `pwd`/uprof_assess_ext  `pwd`/stream.22gb
Generate Report
After collecting data from a batch job, generate reports with the AMDuProfCLI report option:
[arnoldg@dt-login03 uprof_tbp]$ export PATH=/sw/external/amd/AMDuProf_Linux_x64_4.0.341/bin:$PATH
[arnoldg@dt-login03 uprof_tbp]$ AMDuProfCLI report -i AMDuProf-stream-TBP_Dec-19-2022_09-40-27/
/sw/external/amd/AMDuProf_Linux_x64_4.0.341/bin/AMDuProfCLI
Translation started ...
Translation finished
Generated database file : cpu
Report generation started...
Generating report file...

Report generation completed...

Generated report file: /projects/bbka/slurm_test_scripts/cpu/stream/uprof_tbp/AMDuProf-stream-TBP_Dec-19-2022_09-40-27/report.csv
Visualize and Explore Report Data
You can view the data in AMDuProf on Delta or locally with a copy you install on your desktop system. If you install locally, you may need to replicate some paths or add paths to the binary in order to get full functionality.
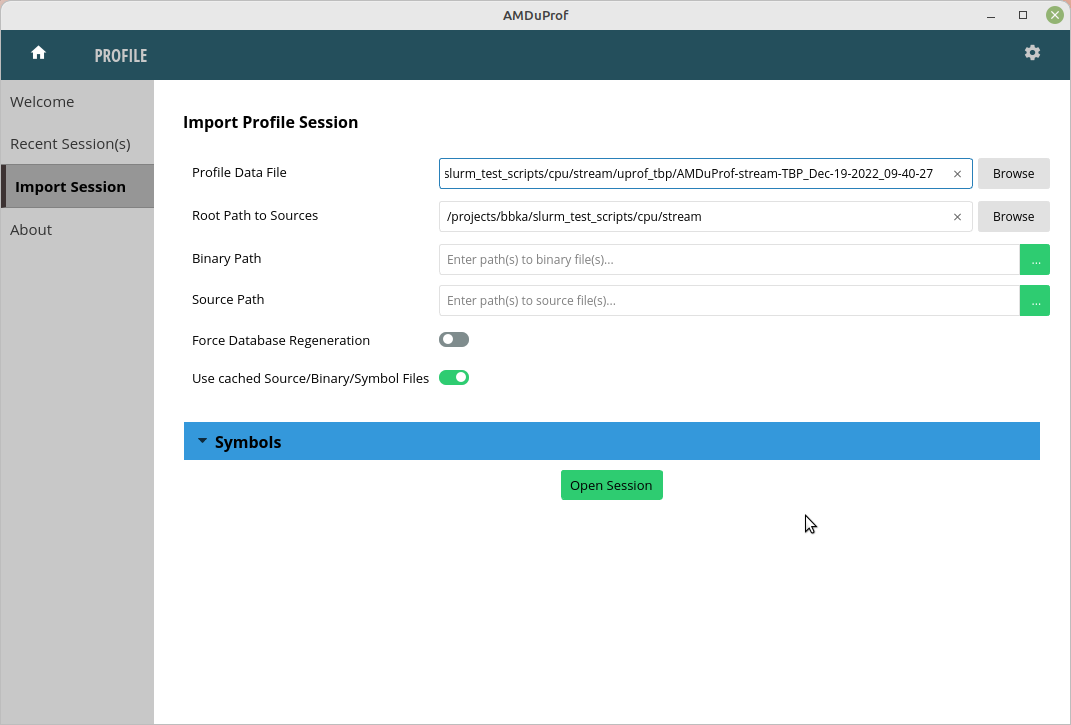
Launch AMDuProf (no CLI suffix for the GUI) and import the profile session from a completed batch job run with AMDuProfCLI collect.
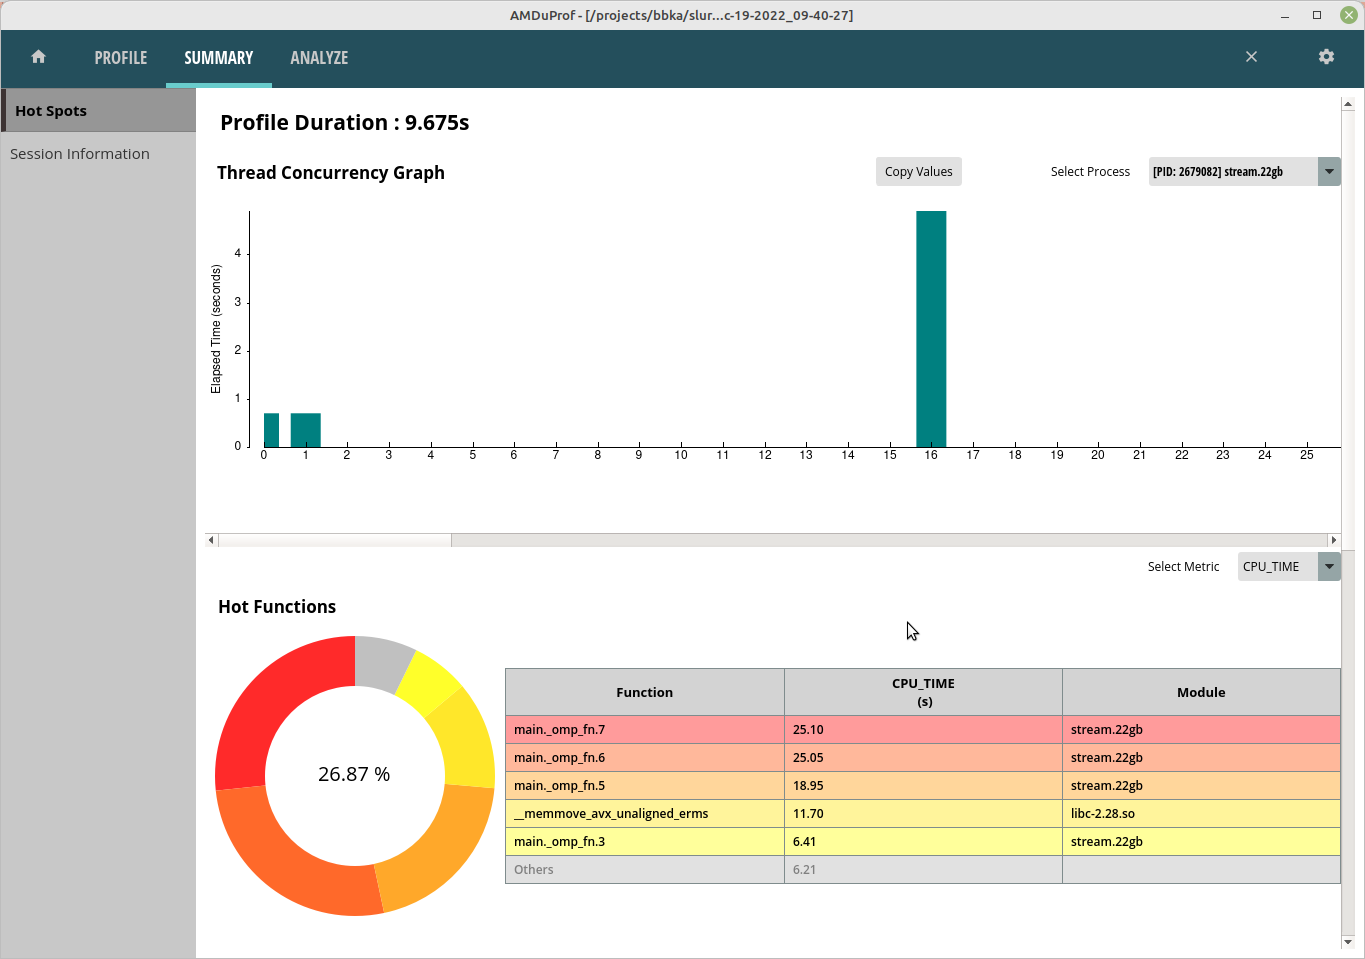
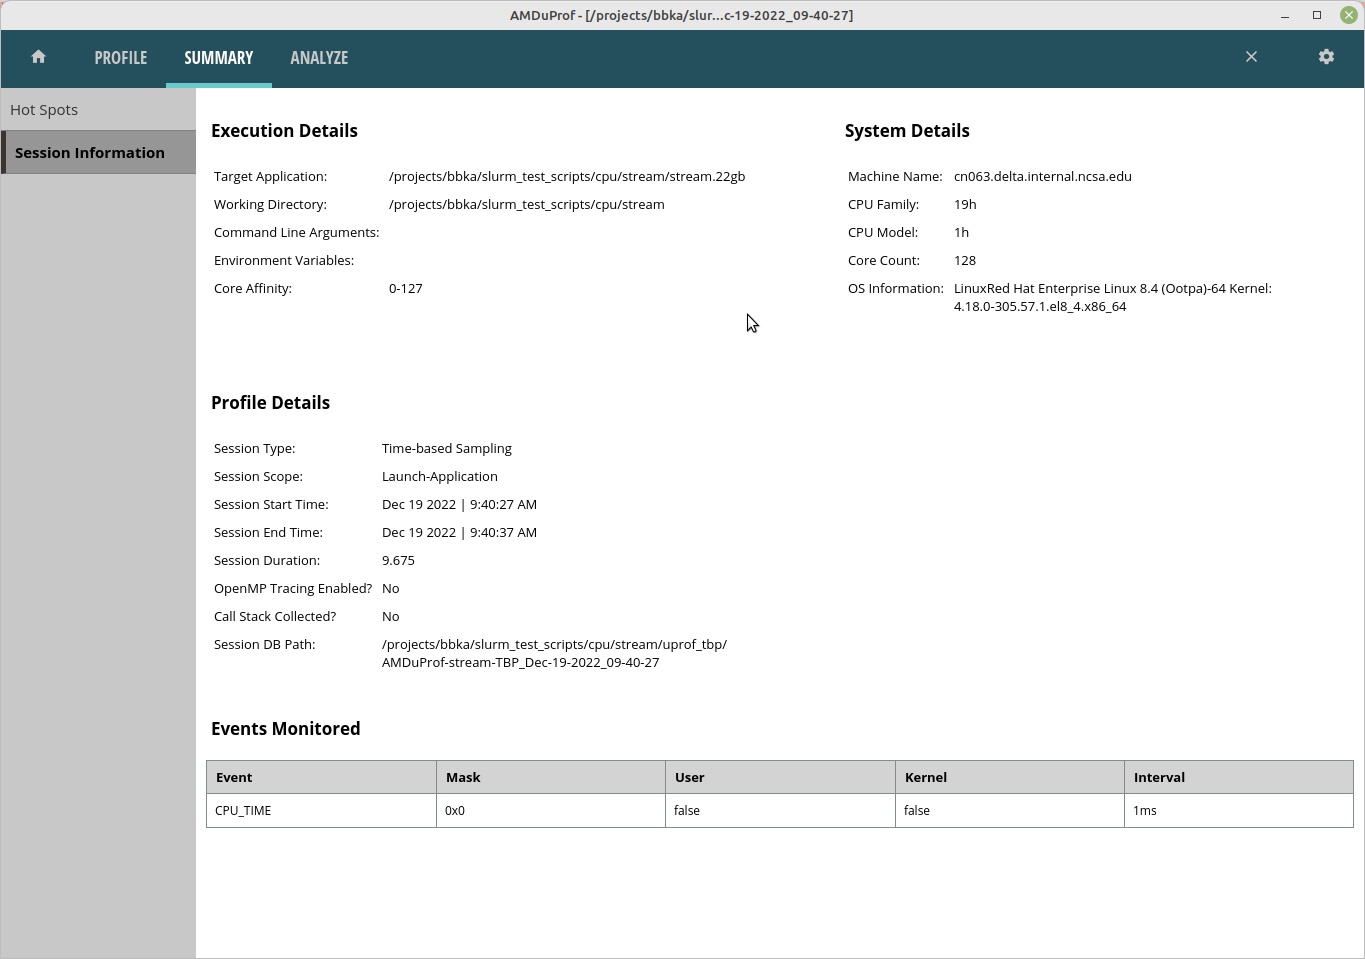
The summary view gives a high-level overview of how time was spent. This is the time-based-profile (tbp) summary.
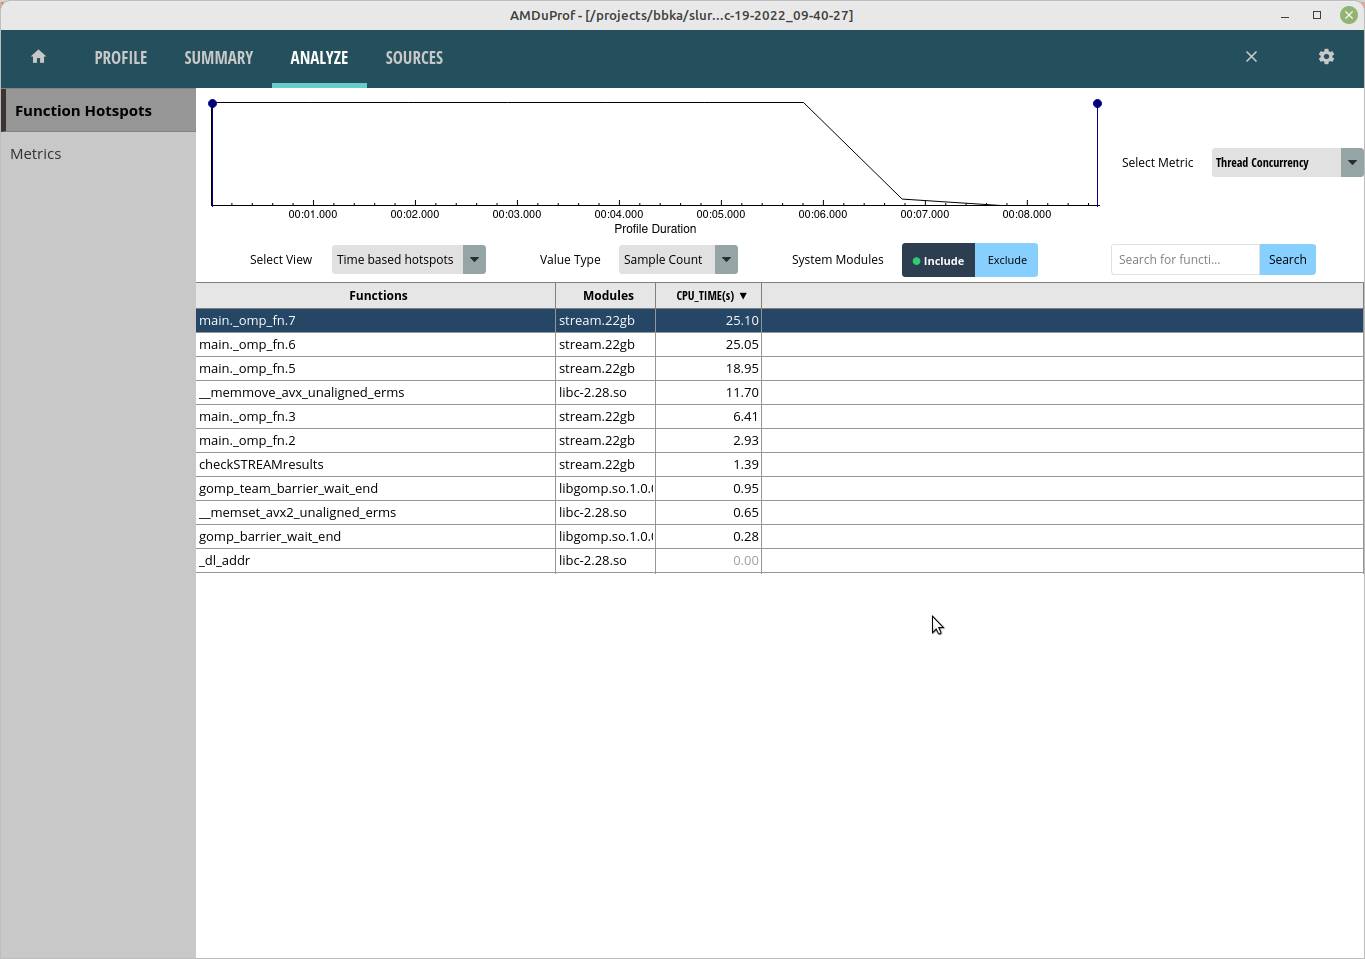
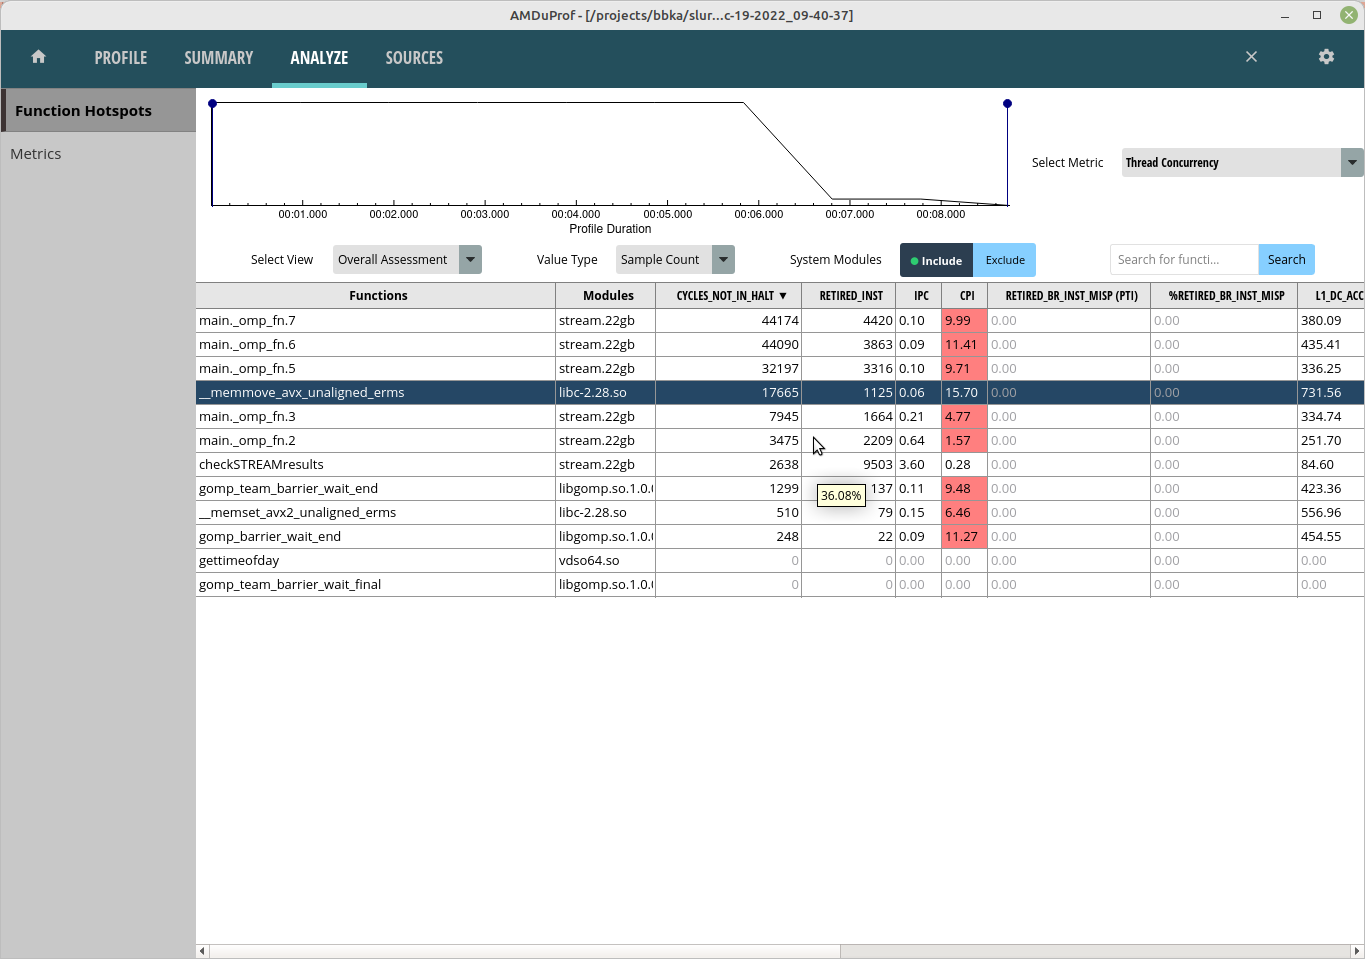
The Analyze tab shows hot routines or lines in more detail. The tbp, assess, and inst_access Analyze views follow.
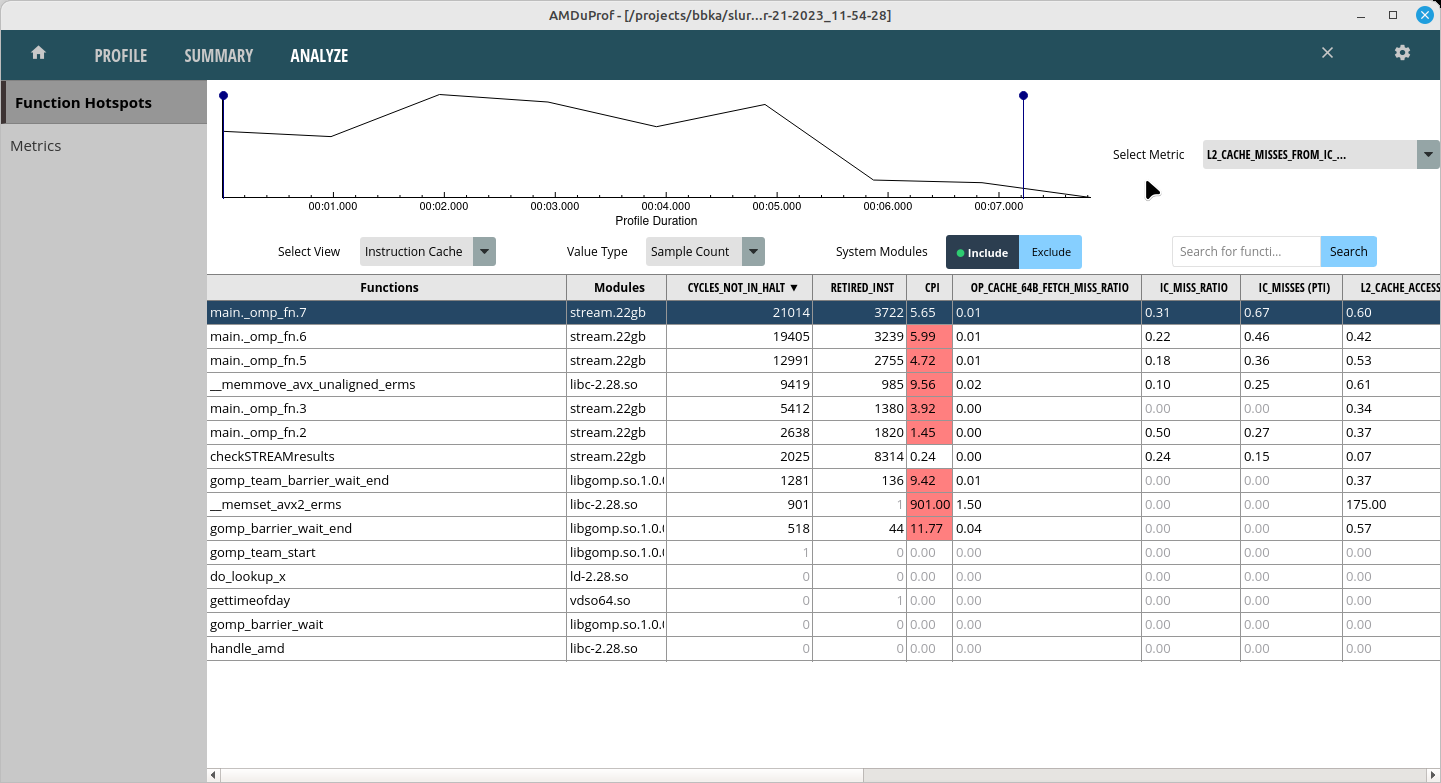
Selecting one of the lines or routines will take you to the Sources view where you can see the assembly used in that portion of the code.

The Session Info is under the Summary tab and displays more detail about the profiling session.
Rooflines
Rooflines are currently disabled. Information on rooflines is in the AMD uProf user guide (section 3.5.2). Below are the roofline error messages from the OS.
srun AMDuProfPcm roofline -o stream-roofline.csv -- ./stream.22gb
Error: NMI watchdog is enabled. NMI uses one Core HW PMC counter.
Please disable NMI watchdog - run with root privilege: echo 0 > /proc/sys/kernel/nmi_watchdog
srun: error: cn061: task 0: Exited with exit code 255
References
HPCtoolkit
$ module load openmpi+cuda hpctoolkit
# get an salloc allocation or do the srun in a batch script, preface your executable with hpcrun
$ srun hpcrun ./osu_ibcast -d cuda
# after that, use hpcprof and hpcviewer on the results
$ hpcprof hpctoolkit-osu_ibcast-measurements-9173774/
INFO: Writing analysis results to default database hpctoolkit-osu_ibcast-database-9173774/
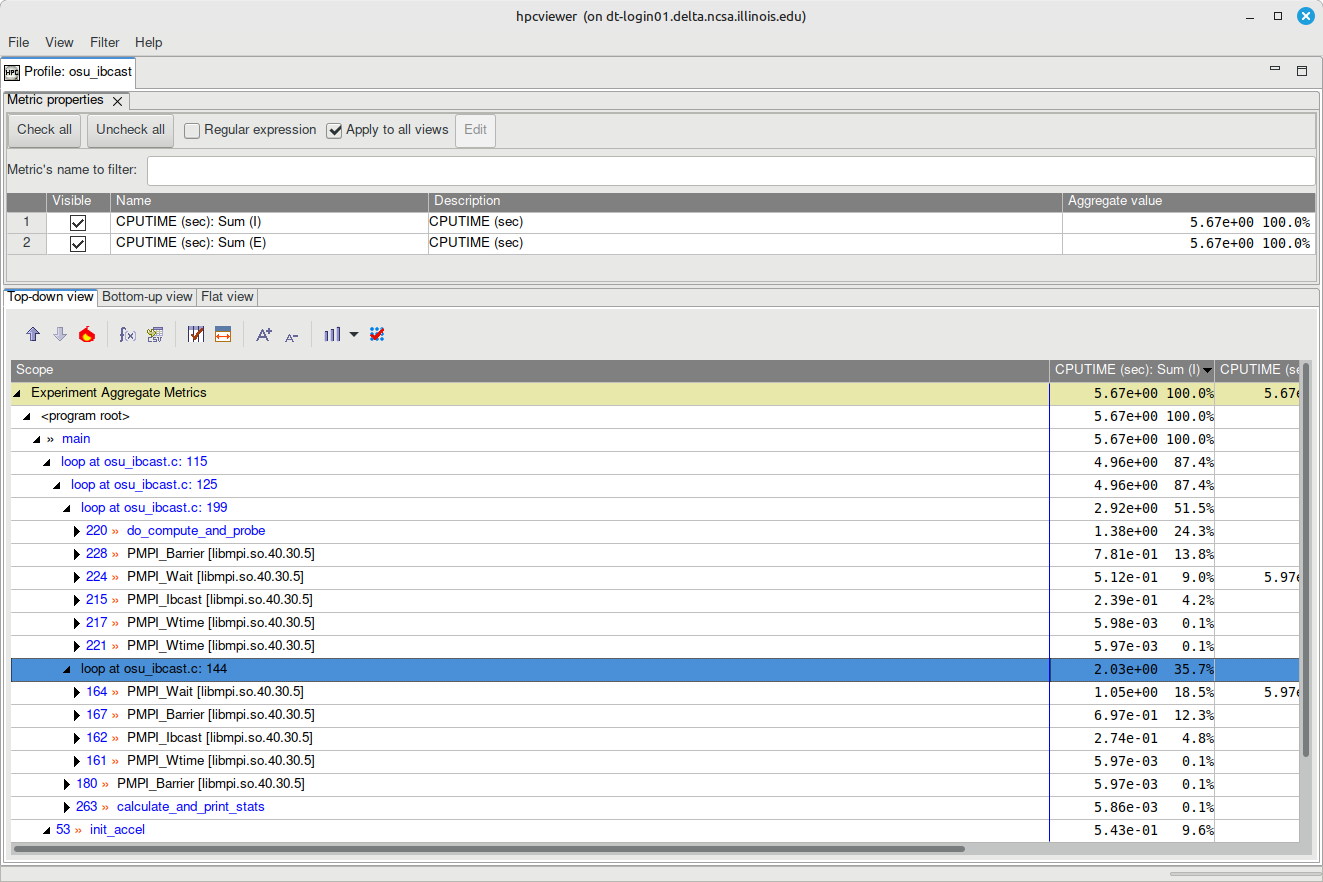
$ hpcviewer hpctoolkit-osu_ibcast-database-9173774/
Java version 11
Redirect standard error to /u/arnoldg/.hpctoolkit/hpcviewer/x86_64/hpcviewer.err
References
NVIDIA Nsight Systems
Installation
The Nsight Systems is included in the CUDA toolkit. A cuda module is loaded by default on Delta.
[arnoldg@dt-login01 ~]$ which nsys
/sw/spack/deltas11-2023-03/apps/linux-rhel8-zen3/gcc-11.4.0/cuda-11.8.0-vfixfmc/bin/nsys
Installation (NVIDIA Nsight Systems Client on Local Desktop/Laptop)
Open the NVIDIA developer tools overview and navigate to the Developer Tools Downloads button.
Select Nsight Systems and your operating system. If you do not have an account at developer.nvidia.com, set one up when prompted. When you have completed the forms, your download will begin.
Install the application on your local machine. You will download output files from the server command line application and use the GUI locally on your laptop.
Run Application on Delta
nsys with serial or python CUDA code
$ srun nsys profile -o /path/to/mynysys.out --stats=true ./a.out
nsys wrapper for MPI and HPC CUDA codes
[arnoldg@dt-login03 gromacs]$ cat nsys_wrap.sh
#!/bin/bash
# Use $PMI_RANK for MPICH, $OMPI_COMM_WORLD_RANK for openmpi, and $SLURM_PROCID with srun.
if [ $SLURM_PROCID -eq 1 ]; then
  nsys profile -e NSYS_MPI_STORE_TEAMS_PER_RANK=1 -o gmx.nsys --gpu-metrics-set=2 "$@"
else
  "$@"
fi
batch script , –constraint=
#SBATCH --constraint=perf,nvperf
...
# the slurm script should run the wrapper above instead of "nsys ..."
time srun $SLURM_SUBMIT_DIR/nsys_wrap.sh \
  gmx_mpi mdrun -nb gpu -pin on -notunepme -dlb yes -v -resethway -noconfout -nsteps 4000 -s water_pme.tpr

# see https://docs.nvidia.com/nsight-systems/UserGuide/index.html#cli-analyze-mpi-codes
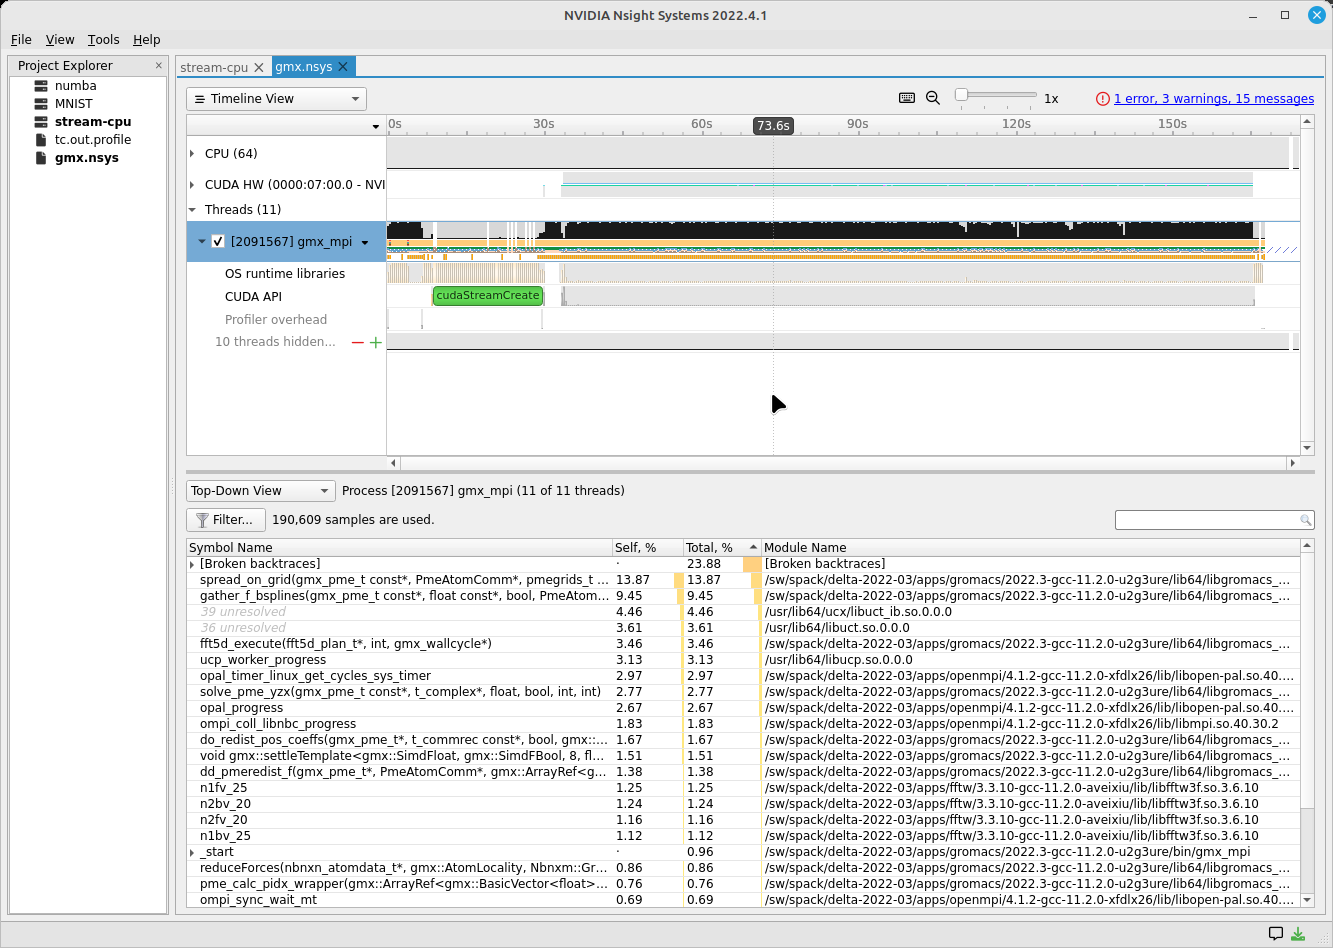
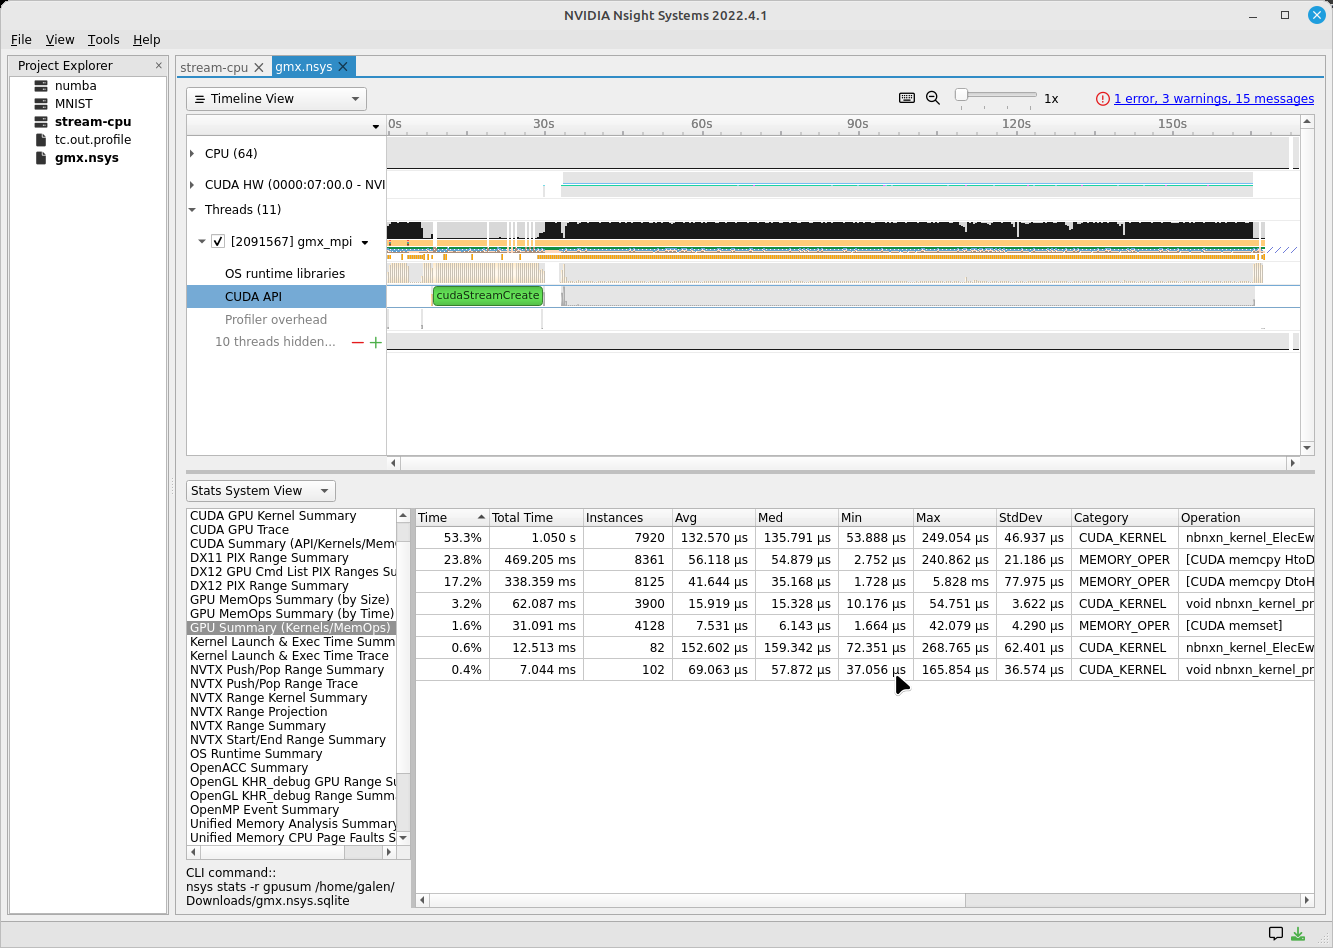
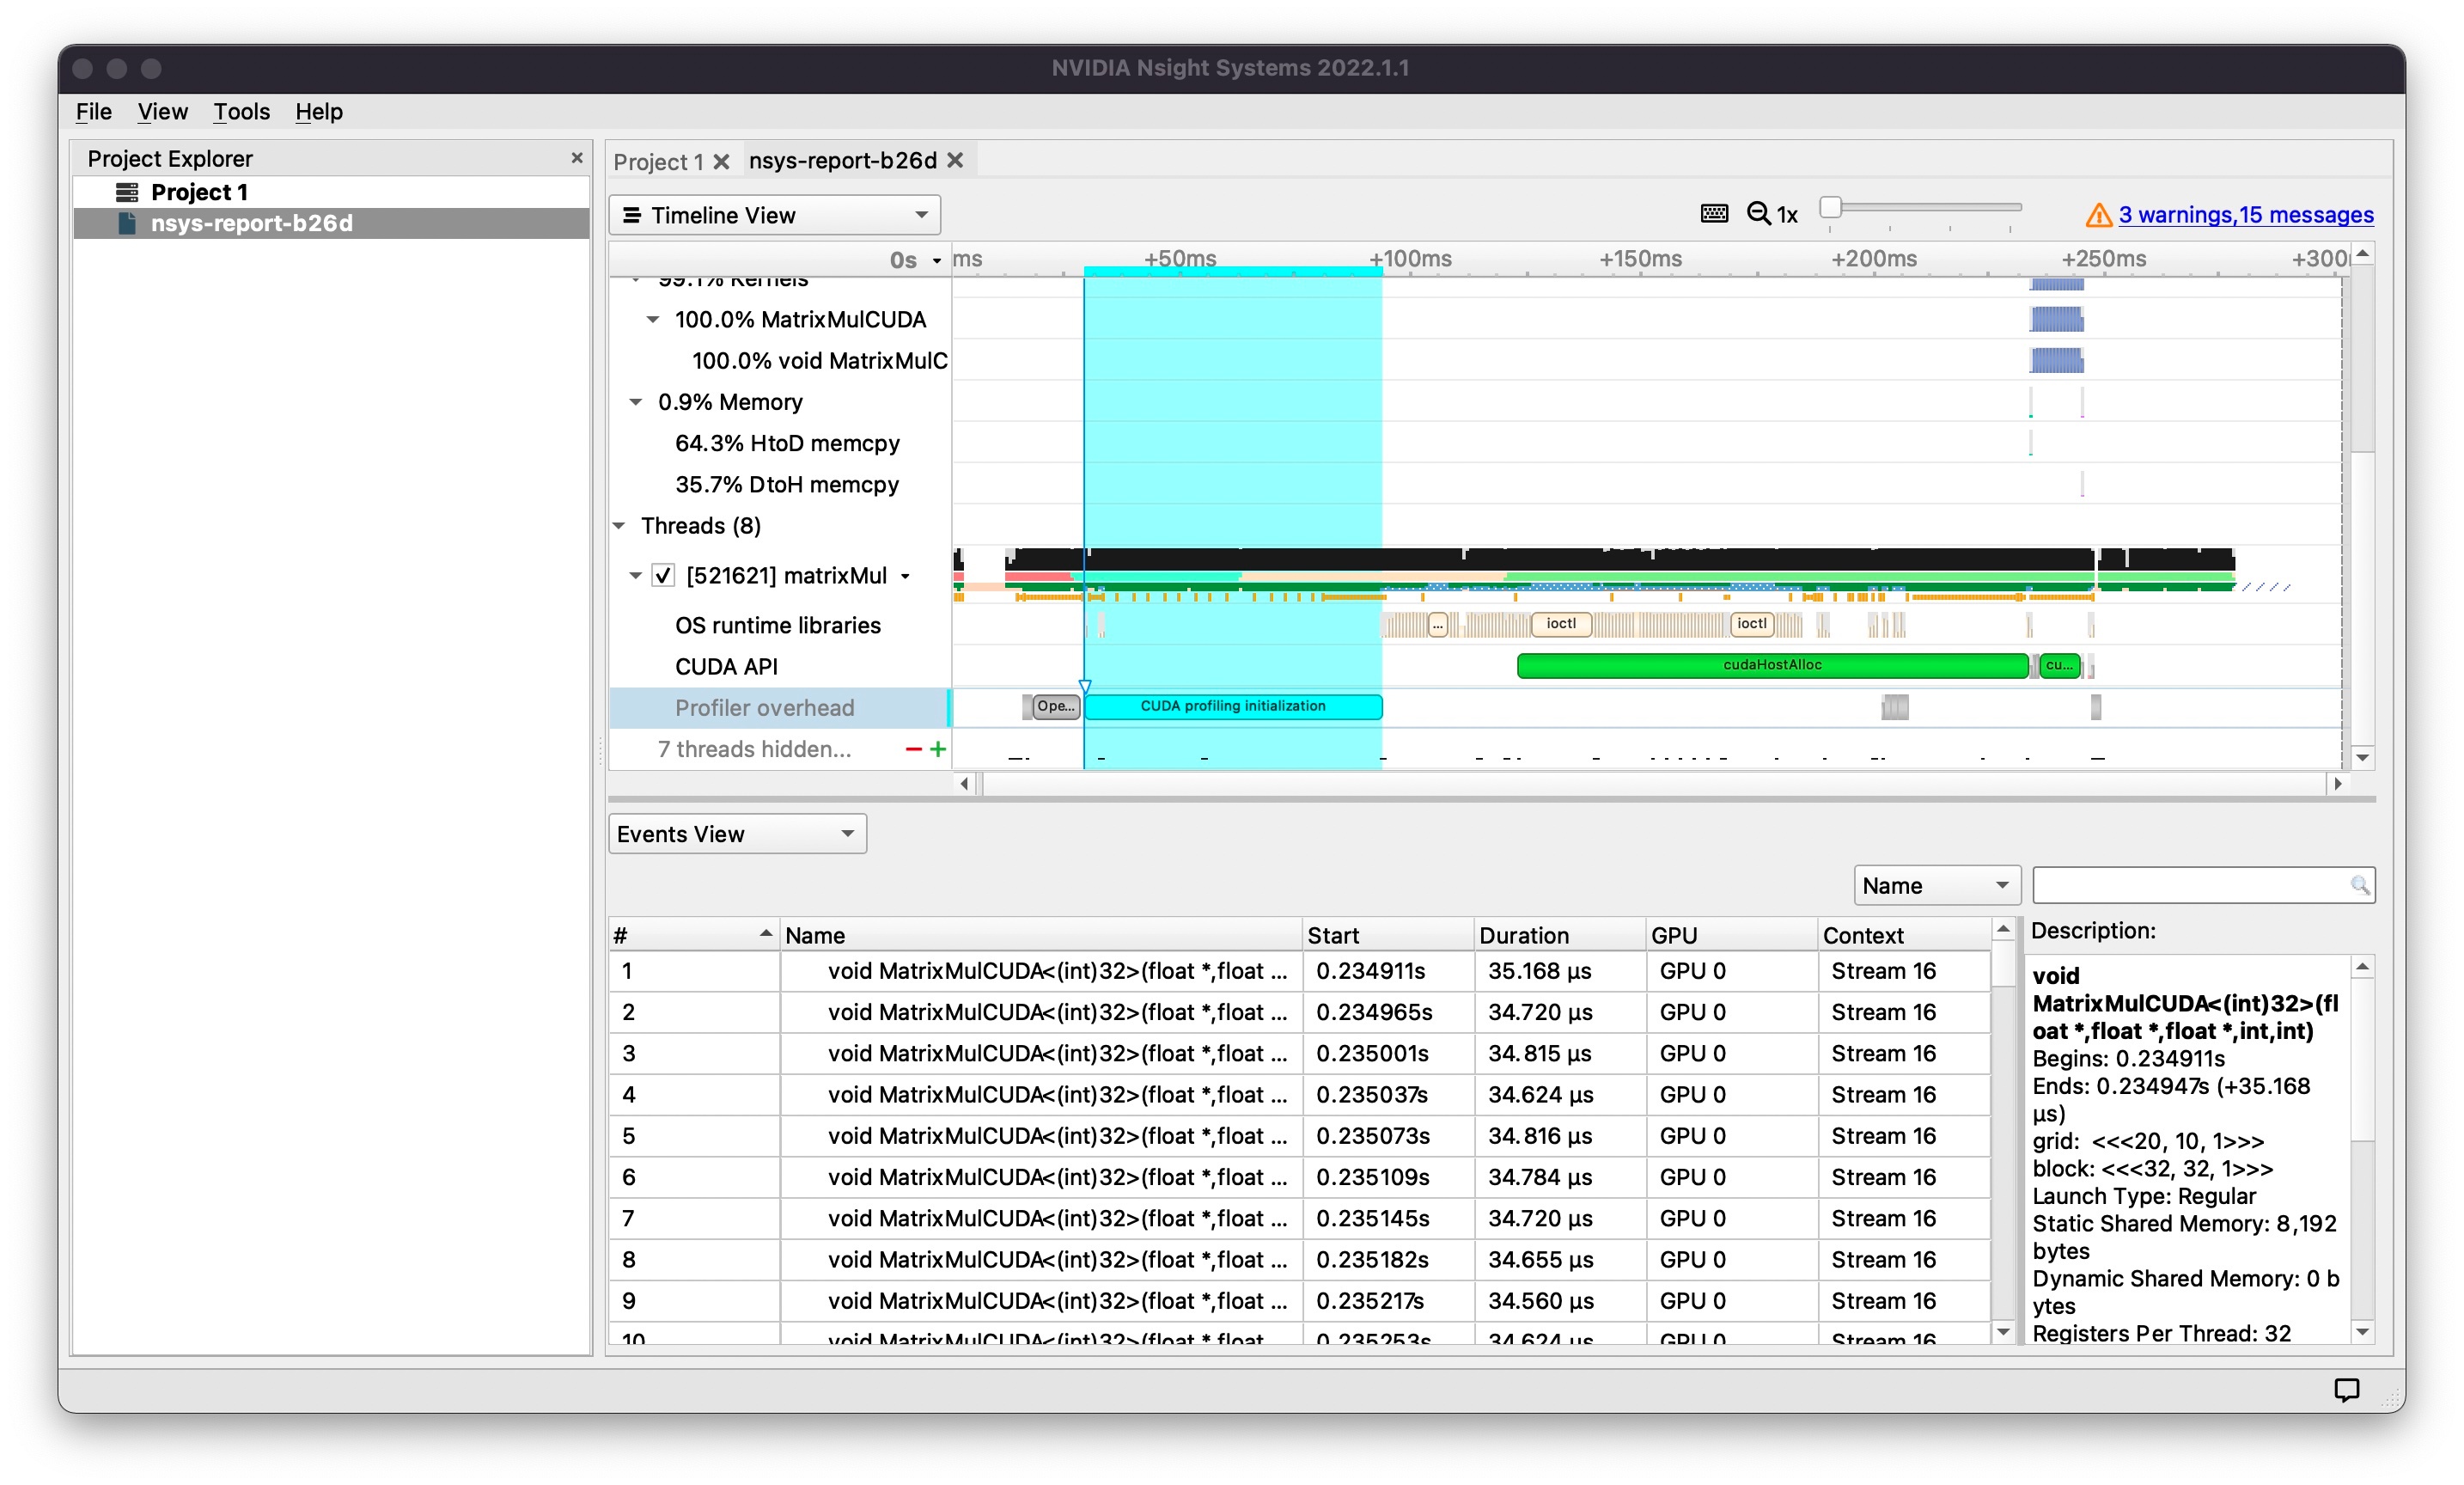
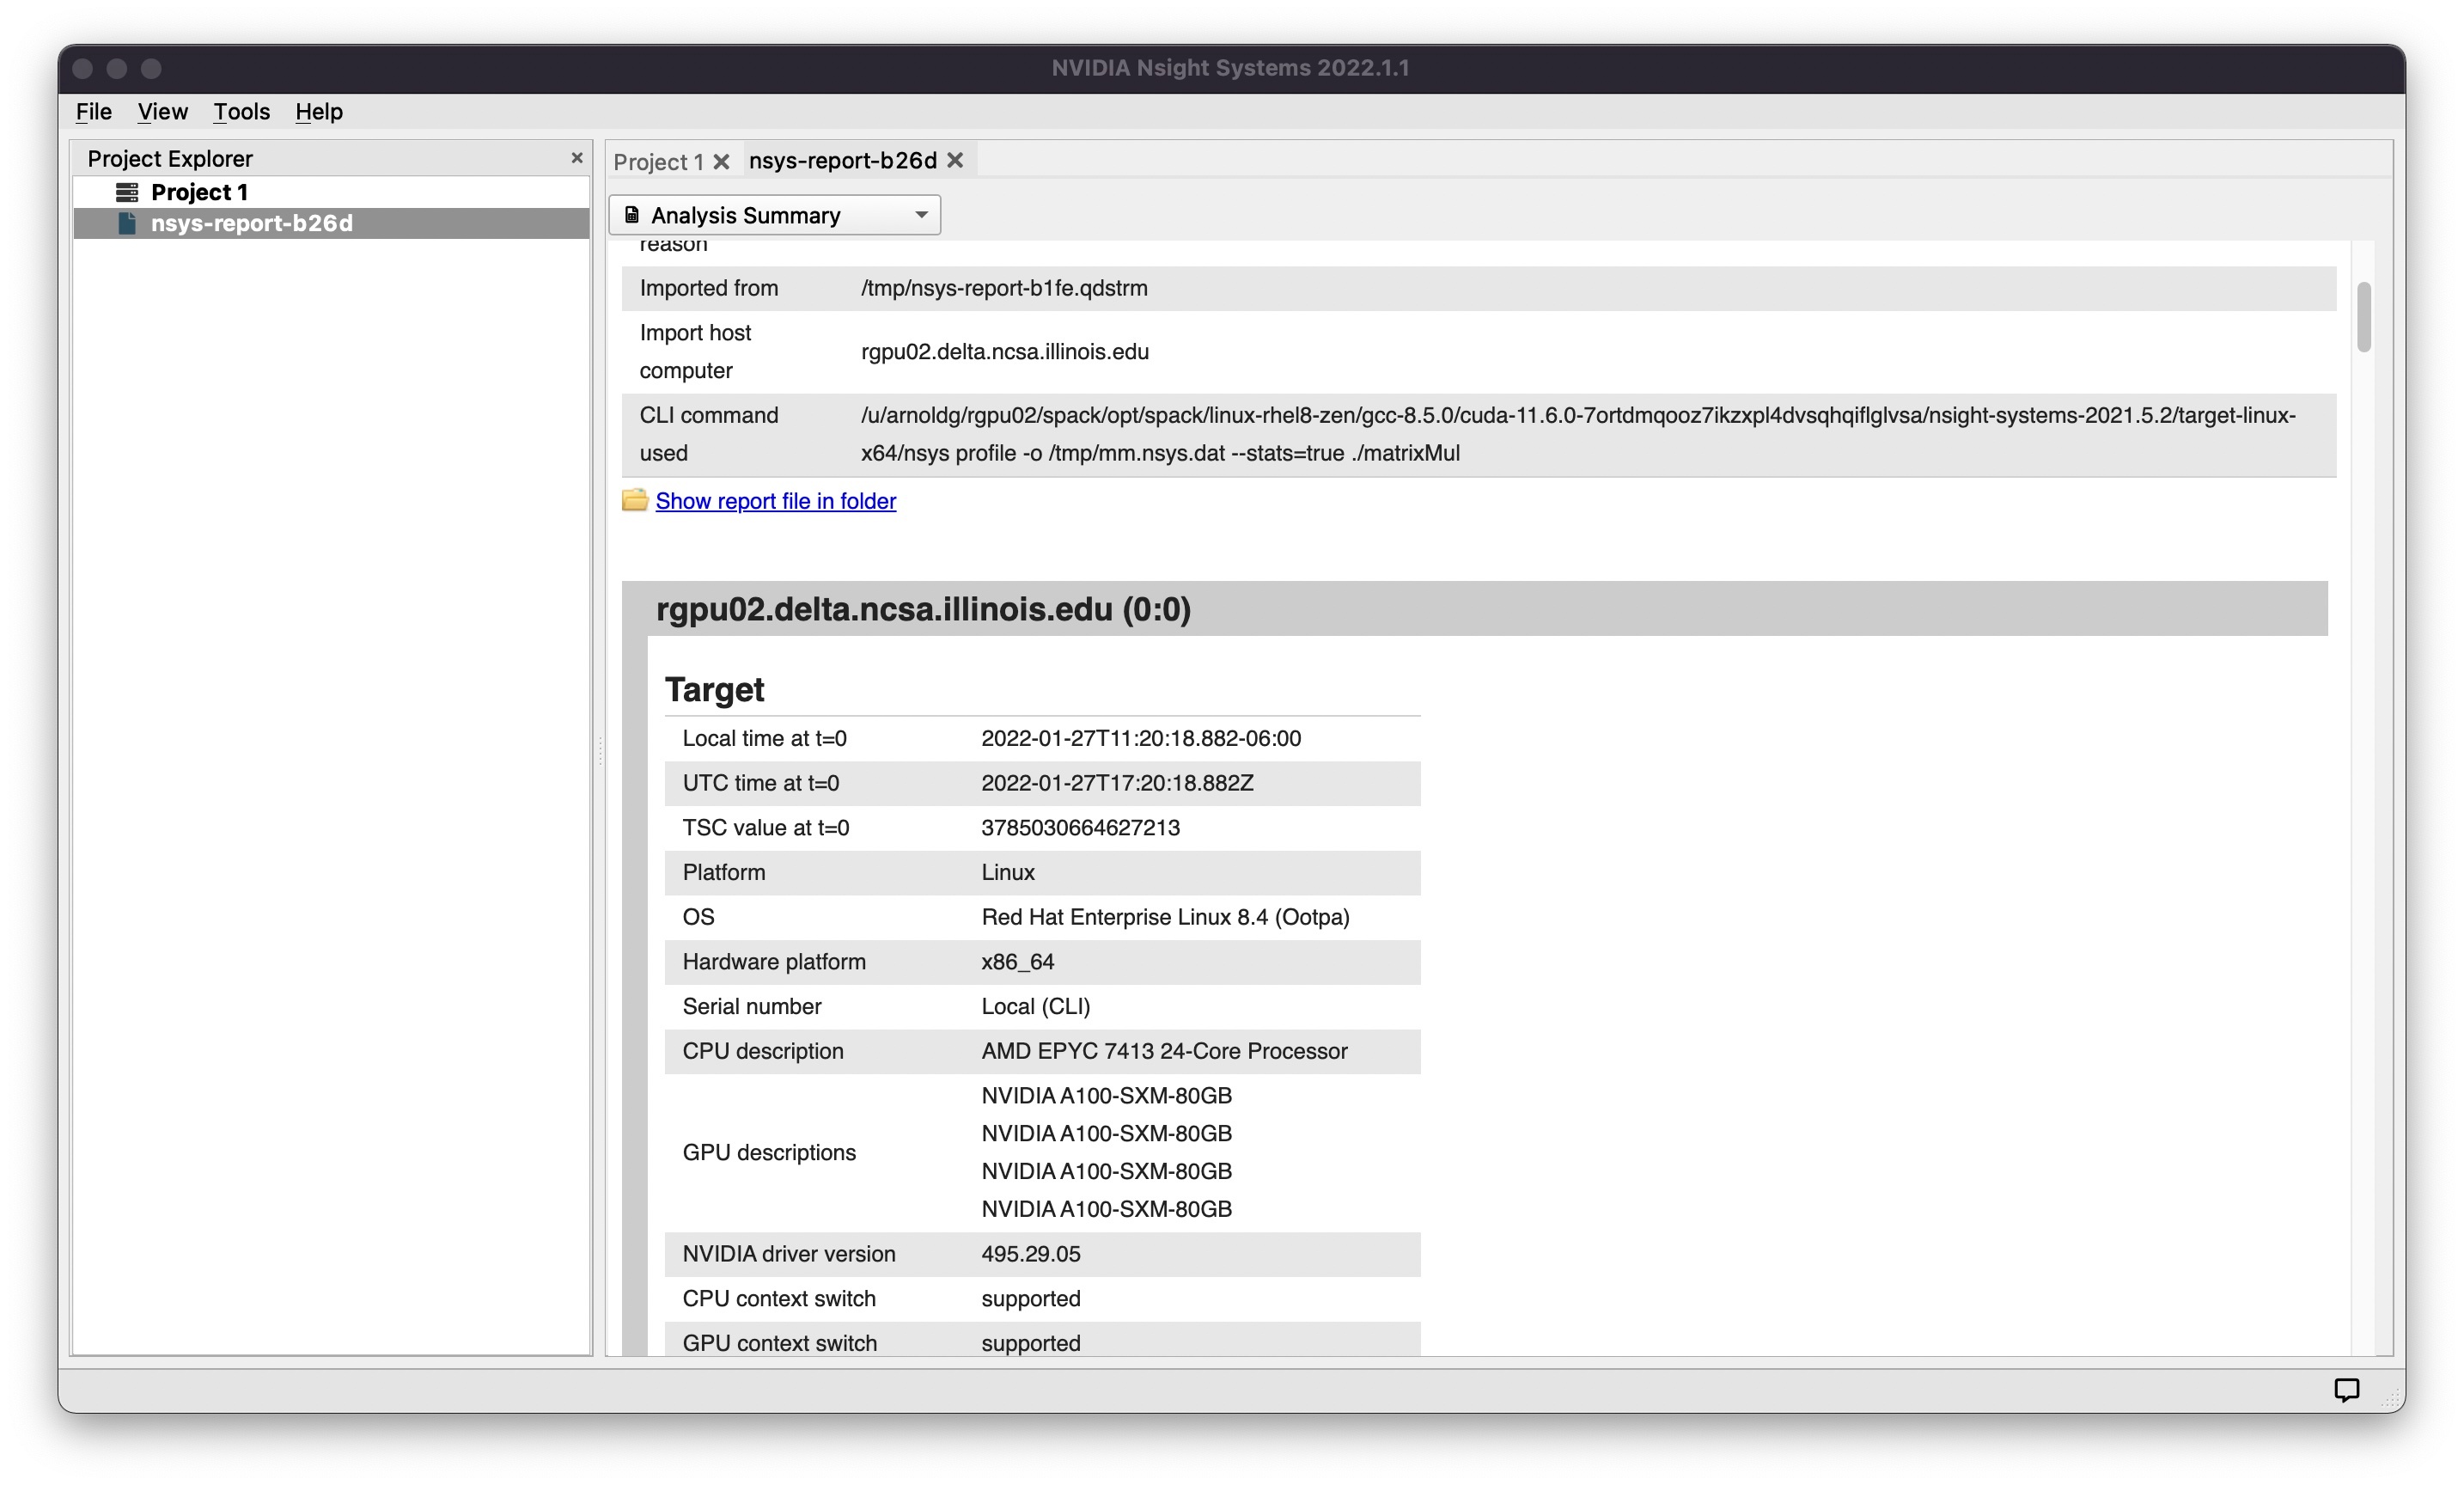
MPI Rank Example Result (Viewing with Nsight on Local Desktop)
Copy Resultant Files to Your Local Laptop (Downloads/ or Documents/)
scp is shown below. You could also use Globus Online, sftp, or an sshfs mount from your laptop.
# Delta
[arnoldg@rgpu02 rgpu02]$ ls /tmp/nsys*
/tmp/nsys-report-988d.sqlite  /tmp/nsys-report-b26d.nsys-rep
[arnoldg@rgpu02 rgpu02]$

# local laptop (MacOS example)
(base) galen@macbookair-m1-042020 ~ % cd Downloads
(base) galen@macbookair-m1-042020 Downloads % pwd
/Users/galen/Downloads
(base) galen@macbookair-m1-042020 Downloads % sftp arnoldg@rgpu02.delta.ncsa.illinois.edu

NCSA Delta System

Login with NCSA Kerberos + Duo multi-factor.

DUO Documentation:  https://go.ncsa.illinois.edu/2fa

(arnoldg@rgpu02.delta.ncsa.illinois.edu) Password:
(arnoldg@rgpu02.delta.ncsa.illinois.edu) Duo two-factor login for arnoldg

Enter a passcode or select one of the following options:

 1. Duo Push to XXX-XXX-1120
 2. Duo Push to Ipad mini (iOS)
 3. Duo Push to red ipod (iOS)

Passcode or option (1-3): 1
Connected to rgpu02.delta.ncsa.illinois.edu.
sftp> cd /tmp
sftp> mget nsys*
Fetching /tmp/nsys-report-988d.sqlite to nsys-report-988d.sqlite
/tmp/nsys-report-988d.sqlite                  100%  748KB   2.7MB/s   00:00
Fetching /tmp/nsys-report-b26d.nsys-rep to nsys-report-b26d.nsys-rep
/tmp/nsys-report-b26d.nsys-rep                100%  288KB   1.7MB/s   00:00
sftp>
Open NVIDIA Nsight Systems
Under the File menu, select open, and then navigate to your Downloads/ folder and select the nsys* file of interest (nays-report-b26d.nsys-rep in this example). Explore the data in the GUI application.
See also: NVTX source code annotations blog article at NVIDIA (can annotate C/C++/python GPU or CPU code)
Python with NVTX
Installing NVTX via pip
[arnoldg@rgpu02 nvtx]$ module load python cuda
[arnoldg@rgpu02 nvtx]$ C_INCLUDE_PATH=$CUDA_HOME/include pip install nvtx
Collecting nvtx
  Using cached nvtx-0.2.3.tar.gz (10 kB)
  Installing build dependencies ... done
  Getting requirements to build wheel ... done
  Preparing metadata (pyproject.toml) ... done
Building wheels for collected packages: nvtx
  Building wheel for nvtx (pyproject.toml) ... done
  Created wheel for nvtx: filename=nvtx-0.2.3-cp39-cp39-linux_x86_64.whl size=177533 sha256=875e0f9d4322d07db4bce397b4281ce301f348cf72e00629b0d7bc23a7db0231
  Stored in directory: /u/arnoldg/.cache/pip/wheels/66/7a/44/68c48f02433263010768b540b0e90bf5a224dd7e6612d88887
Successfully built nvtx
Installing collected packages: nvtx
Successfully installed nvtx-0.2.3
[arnoldg@rgpu02 nvtx]$
Run with NSYS CLI
[arnoldg@rgpu02 nvtx]$ nsys profile -o nvtx_simple.profile --stats=true ./nvtx_simple.py

Warning: LBR backtrace method is not supported on this platform. DWARF backtrace method will be used.
0
1
2
3
4
Failed to create '/u/arnoldg/rgpu02/cuda/nvtx/nvtx_simple.profile.nsys-rep': File exists.
Use `--force-overwrite true` to overwrite existing files.
Generating '/tmp/nsys-report-1c93.qdstrm'
[1/8] [========================100%] nsys-report-d073.nsys-rep
Failed to create '/u/arnoldg/rgpu02/cuda/nvtx/nvtx_simple.profile.sqlite': File exists.
Use `--force-overwrite true` to overwrite existing files.
[2/8] [========================100%] nsys-report-e498.sqlite
SKIPPED: /tmp/nsys-report-e498.sqlite does not contain CUDA trace data.
SKIPPED: /tmp/nsys-report-e498.sqlite does not contain CUDA kernel data.
SKIPPED: /tmp/nsys-report-e498.sqlite does not contain GPU memory data.
SKIPPED: /tmp/nsys-report-e498.sqlite does not contain GPU memory data.
[3/8] Executing 'nvtxsum' stats report

NVTX Range Statistics:

 Time (%)  Total Time (ns)  Instances      Avg (ns)          Med (ns)         Min (ns)        Max (ns)       StdDev (ns)     Style   Range
 --------  ---------------  ---------  ----------------  ----------------  --------------  --------------  ---------------  -------  -----
     50.0   10,010,633,188          1  10,010,633,188.0  10,010,633,188.0  10,010,633,188  10,010,633,188              0.0  PushPop  f()
     50.0   10,010,401,574          5   2,002,080,314.8   2,002,090,885.0          15,729   4,004,111,558  1,582,756,979.0  PushPop  loop

[4/8] Executing 'osrtsum' stats report

Operating System Runtime API Statistics:

 Time (%)  Total Time (ns)  Num Calls     Avg (ns)         Med (ns)      Min (ns)    Max (ns)       StdDev (ns)           Name
 --------  ---------------  ---------  ---------------  ---------------  --------  -------------  ---------------  -------------------
    100.0   10,010,198,683          5  2,002,039,736.6  2,002,047,874.0     3,025  4,004,056,124  1,582,740,553.2  select
      0.0        1,005,734         46         21,863.8         21,656.0    18,866         27,070          1,608.1  open64
      0.0          495,879         49         10,120.0          4,960.0     1,262         67,747         12,669.1  read
      0.0           38,843         10          3,884.3          3,957.5     3,186          4,559            408.1  mmap64
      0.0           34,164          1         34,164.0         34,164.0    34,164         34,164              0.0  write
      0.0           27,391          4          6,847.8          4,182.5     2,655         16,371          6,410.6  fopen64
      0.0            6,602          3          2,200.7          1,232.0     1,172          4,198          1,730.0  pthread_cond_signal
      0.0            3,647          1          3,647.0          3,647.0     3,647          3,647              0.0  sigaction
      0.0            2,013          1          2,013.0          2,013.0     2,013          2,013              0.0  fread
      0.0            1,923          1          1,923.0          1,923.0     1,923          1,923              0.0  fclose
      0.0            1,472          1          1,472.0          1,472.0     1,472          1,472              0.0  fflush

[5/8] Executing 'cudaapisum' stats report
[6/8] Executing 'gpukernsum' stats report
[7/8] Executing 'gpumemtimesum' stats report
[8/8] Executing 'gpumemsizesum' stats report
Generated:
    /tmp/nsys-report-d073.nsys-rep
    /tmp/nsys-report-e498.sqlite
[arnoldg@rgpu02 nvtx]$
nsys profile --gpu-metrics-device=all \
    --gpu-metrics-frequency=20000 <application>   # get metrics from the cuda libs/api

ncu --metrics "regex:.*" <application>   # get all gpu metrics from the hardware
Delta Script and Nsight Systems View of the Resulting Report
#!/bin/bash
#SBATCH --job-name="numba_profile"
#SBATCH --partition=gpuA100x4-interactive
#SBATCH --mem=16G
#SBATCH --nodes=1
#SBATCH --ntasks-per-node=1
#SBATCH --cpus-per-task=2   # spread out to use 1 core per numa
#SBATCH --constraint="projects"
#SBATCH --gpus-per-node=1
#SBATCH --gpu-bind=closest   # select a cpu close to gpu on pci bus topology
#SBATCH --account=account_name    # <- match to a "Project" returned by the "accounts" command
#SBATCH -t 00:10:00

cd $SLURM_SUBMIT_DIR
module load anaconda3_gpu

dcgmi profile --pause

srun nsys profile \
  --gpu-metrics-device=all \
  ./nvtx-numba-jit.py

srun ncu \
  --metrics "regex:.*" \
  --target-processes all \
  ./nvtx-numba-jit.py

dcgmi profile --resume
(Transferred the report1.nsys-rep back to local system using Globus Online, sftp, etc.)
Nsight Systems Setup on Local Workstation to Use with Delta
Log into the NVIDIA Nsight systems developer page (make an account if you need to), and download the client for your MacOS, Windows, or Linux local system.
You can use Globus Online, rsync, sftp, or sshfs (Linux) to transfer files (or view files as local filesystem mounts in the case of sshfs) with the local Nsight Systems client.
sshfs Mount Example for Linux Box to Delta:
galen@galen-HP-ProBook-455-G6:~$ sshfs arnoldg@dt-login03.delta.ncsa.illinois.edu:/projects/bbka delta_projects/
arnoldg@dt-login03.delta.ncsa.illinois.edu's password:
(arnoldg@dt-login03.delta.ncsa.illinois.edu) Duo two-factor login for arnoldg

Enter a passcode or select one of the following options:

 1. Duo Push to XXX-XXX-1120
 2. Duo Push to Ipad mini (iOS)
 3. Duo Push to red ipod (iOS)
 4. Duo Push to Android

Passcode or option (1-4): 115489
galen@galen-HP-ProBook-455-G6:~$ df -h delta_projects/
Filesystem                                                 Size  Used Avail Use% Mounted on
arnoldg@dt-login03.delta.ncsa.illinois.edu:/projects/bbka 1000T   60T  941T   6% /home/galen/delta_projects
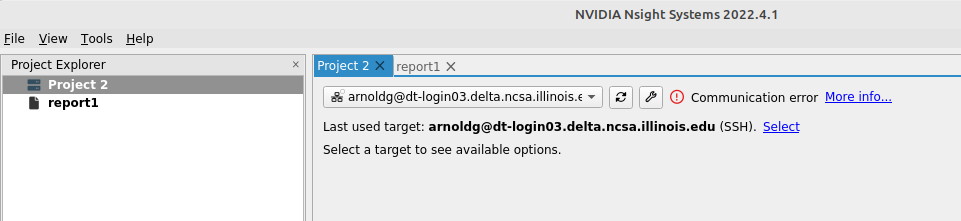
Launch Nsight Systems and define a target under the default opening view. Even if you cannot get Nsight Systems to SSH to the target, you need to define it so that Nsight Systems will present you with the .nsys-rep file type when you try to open a profile from delta that was transferred to local via GO/sftp/rsync or viewable via the sshfs fuse mount like shown above:
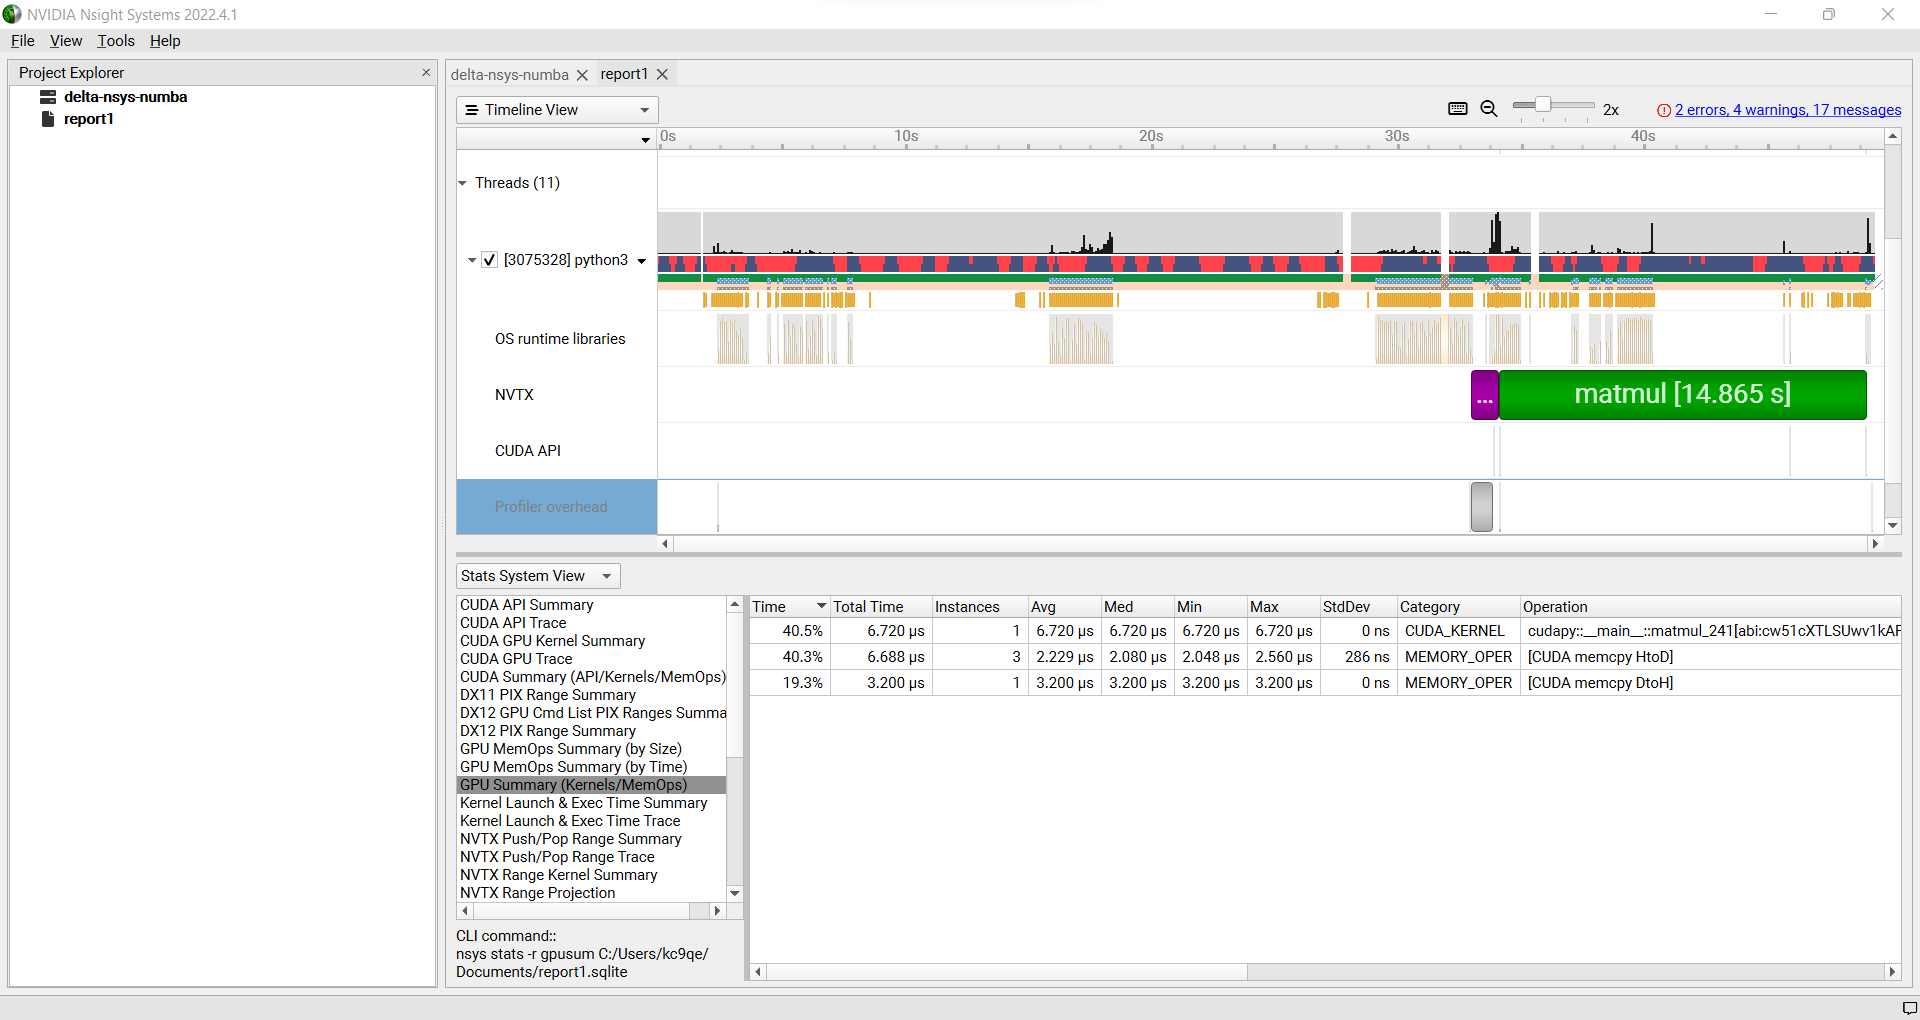
Then open the profile report generated from an srun nsys … at Delta (navigate to Download or the live sshfs fuse mount).

Proceed to use Nsight Systems. A stats view of the GPU Summary is shown. This is usually a good performance analysis starting point showing utilization of kernels vs times to transfer data between the host computer and the GPU accelerator.

NVIDIA CUDA C++ programming guide
NVIDIA Nsight Systems user guide (nsys higher level and cuda api )
NVIDIA Nsight Compute CLI documentation (ncu lower level and counters )
GitHub - quasiben/nvtx-examples (sample python test codes )
Linux Perf performance counting
The linux perf subsystem can access hardware performance counters and summarize them per application execution.
Refer to the Linux perf command wiki page.
[arnoldg@dt-login03 stream]$ srun -n 1 perf stat ./stream.22gb
...
-------------------------------------------------------------
Function    Best Rate MB/s  Avg time     Min time     Max time
Copy:           42048.7     0.380511     0.380511     0.380511
Scale:          23543.7     0.679587     0.679587     0.679587
Add:            26716.7     0.898315     0.898315     0.898315
Triad:          26639.3     0.900925     0.900925     0.900925
-------------------------------------------------------------
Solution Validates: avg error less than 1.000000e-13 on all three arrays
-------------------------------------------------------------

 Performance counter stats for './stream.22gb':

        17,206.19 msec task-clock:u              #    1.000 CPUs utilized
                0      context-switches:u        #    0.000 /sec
                0      cpu-migrations:u          #    0.000 /sec
        4,822,101      page-faults:u             #  280.254 K/sec
   30,092,687,800      cycles:u                  #    1.749 GHz                      (83.33%)
       36,504,747      stalled-cycles-frontend:u #    0.12% frontend cycles idle     (83.34%)
    3,916,402,169      stalled-cycles-backend:u  #   13.01% backend cycles idle      (83.33%)
   49,637,948,722      instructions:u            #    1.65  insn per cycle
                                                 #    0.08  stalled cycles per insn  (83.33%)
    5,128,886,029      branches:u                #  298.084 M/sec                    (83.33%)
        4,838,605      branch-misses:u           #    0.09% of all branches          (83.33%)

     17.212796833 seconds time elapsed

      8.291209000 seconds user
      8.693619000 seconds sys


[arnoldg@dt-login03 stream]$
Linux/Unix gprof
gprof generates a sampling profile of function calls in a program. It’s a good general purpose command-line profiler to use when getting started and it has low overhead.
See:
Per the last link, set GMON_OUT_PREFIX for MPI programs so that you get a gprof per rank and compile with “-pg” or “-p” flags.
Linux/Unix strace
strace will trace or summarize system call activity for a program (the portion of time going to system due to i/o, networking, memory allocations or anything else provided by the kernel to the executing code).
See the strace documentation.
[arnoldg@dt-login03 stream]$ srun -n 1 strace -c ./stream.22gb
...
-------------------------------------------------------------
Function    Best Rate MB/s  Avg time     Min time     Max time
Copy:           39529.6     0.404760     0.404760     0.404760
Scale:          19414.2     0.824138     0.824138     0.824138
Add:            16855.4     1.423877     1.423877     1.423877
Triad:           8487.3     2.827755     2.827755     2.827755
-------------------------------------------------------------
Solution Validates: avg error less than 1.000000e-13 on all three arrays
-------------------------------------------------------------
% time     seconds  usecs/call     calls    errors syscall
------ ----------- ----------- --------- --------- ------------------
 46.11    0.001084           9       113       107 openat
 24.16    0.000568           5        99        91 stat
 14.25    0.000335         335         1           execve
  3.32    0.000078           5        14           mmap
  2.30    0.000054           5        10           mprotect
  2.17    0.000051          25         2           getdents64
  1.62    0.000038           3        12           futex
  1.15    0.000027           3         7           read
  1.02    0.000024           3         7           fstat
  0.81    0.000019           3         6           close
  0.38    0.000009           9         1           write
  0.38    0.000009           3         3           lseek
  0.38    0.000009           9         1           munmap
  0.38    0.000009           3         3           brk
  0.26    0.000006           3         2           rt_sigaction
  0.26    0.000006           6         1         1 access
  0.26    0.000006           3         2         1 arch_prctl
  0.17    0.000004           4         1           getrandom
  0.13    0.000003           3         1           rt_sigprocmask
  0.13    0.000003           3         1           sched_getaffinity
  0.13    0.000003           3         1           set_tid_address
  0.13    0.000003           3         1           set_robust_list
  0.13    0.000003           3         1           prlimit64
------ ----------- ----------- --------- --------- ------------------
100.00    0.002351           8       290       200 total
[arnoldg@dt-login03 stream]$
mpiP MPI profiling
mpiP is a light-weight profiling library for MPI. It collects statistical information about MPI functions and has very little overhead.
See the mpiP GitHub repository.
[arnoldg@dt-login03 arnoldg]$ module load mpip
[arnoldg@dt-login03 arnoldg]$ module load ior
[arnoldg@dt-login03 arnoldg]$ srun ior
mpiP:
mpiP: mpiP V3.5.0 (Build Jan 16 2025/11:00:55)
mpiP:
IOR-3.3.0: MPI Coordinated Test of Parallel I/O
Began               : Thu Jan 16 11:17:06 2025
Command line        : /sw/spack/deltas11-2023-03/apps/linux-rhel8-zen3/gcc-11.4.0/ior-3.3.0-yse3iig/bin/ior
Machine             : Linux cn002.delta.ncsa.illinois.edu
TestID              : 0
StartTime           : Thu Jan 16 11:17:06 2025
Path                : /work/hdd/bbka/arnoldg
FS                  : 134.8 TiB   Used FS: 10.5%   Inodes: 223.7 Mi   Used Inodes: 2.7%
...
Summary of all tests:
Operation   Max(MiB)   Min(MiB)  Mean(MiB)     StdDev   Max(OPs)   Min(OPs)  Mean(OPs)     StdDev    Mean(s) Stonewall(s) Stonewall(MiB) Test# #Tasks tPN reps fPP reord reordoff reordrand seed segcnt   blksiz    xsize aggs(MiB)   API RefNum
write         339.10     339.10     339.10       0.00    1356.40    1356.40    1356.40       0.00    0.03539         NA            NA     0     12  12    1   0     0        1         0    0      1  1048576   262144      12.0 POSIX      0
read          640.69     640.69     640.69       0.00    2562.76    2562.76    2562.76       0.00    0.01873         NA            NA     0     12  12    1   0     0        1         0    0      1  1048576   262144      12.0 POSIX      0
Finished            : Thu Jan 16 11:17:07 2025
mpiP:
mpiP: Storing mpiP output in [./ior.12.744965.1.mpiP].
mpiP:
[arnoldg@dt-login03 arnoldg]$ more ior.12.744965.1.mpiP
@ mpiP
@ Command : /sw/spack/deltas11-2023-03/apps/linux-rhel8-zen3/gcc-11.4.0/ior-3.3.0-yse3iig/bin/ior
@ Version                  : 3.5.0
@ MPIP Build date          : Jan 16 2025, 11:00:55
@ Start time               : 2025 01 16 11:17:06
@ Stop time                : 2025 01 16 11:17:07
@ Timer Used               : PMPI_Wtime
@ MPIP env var             : [null]
@ Collector Rank           : 0
@ Collector PID            : 744965
@ Final Output Dir         : .
@ Report generation        : Single collector task
@ MPI Task Assignment      : 0 cn002.delta.ncsa.illinois.edu
@ MPI Task Assignment      : 1 cn002.delta.ncsa.illinois.edu
@ MPI Task Assignment      : 2 cn002.delta.ncsa.illinois.edu
@ MPI Task Assignment      : 3 cn002.delta.ncsa.illinois.edu
@ MPI Task Assignment      : 4 cn002.delta.ncsa.illinois.edu
@ MPI Task Assignment      : 5 cn002.delta.ncsa.illinois.edu
@ MPI Task Assignment      : 6 cn002.delta.ncsa.illinois.edu
@ MPI Task Assignment      : 7 cn002.delta.ncsa.illinois.edu
@ MPI Task Assignment      : 8 cn002.delta.ncsa.illinois.edu
@ MPI Task Assignment      : 9 cn002.delta.ncsa.illinois.edu
@ MPI Task Assignment      : 10 cn002.delta.ncsa.illinois.edu
@ MPI Task Assignment      : 11 cn002.delta.ncsa.illinois.edu

---------------------------------------------------------------------------
@--- MPI Time (seconds) ---------------------------------------------------
---------------------------------------------------------------------------
Task    AppTime    MPITime     MPI%
   0      0.274     0.0207     7.57
   1      0.273      0.214    78.48
   2      0.273      0.213    78.08
   3      0.273      0.213    78.04
   4      0.273      0.213    78.12
   5      0.273      0.214    78.42
...
---------------------------------------------------------------------------
@--- Callsite Time statistics (all, milliseconds): 420 --------------------
---------------------------------------------------------------------------
Name              Site Rank  Count      Max     Mean      Min   App%   MPI%
Allreduce            8    0      1    0.029    0.029    0.029   0.01   0.14
Allreduce            8    *      1    0.029    0.029    0.029   0.00   0.00

Allreduce           17    0      1    0.154    0.154    0.154   0.06   0.74
Allreduce           17    *      1    0.154    0.154    0.154   0.00   0.01

Allreduce           19    0      1   0.0275   0.0275   0.0275   0.01   0.13
Allreduce           19    *      1   0.0275   0.0275   0.0275   0.00   0.00
Debugging MPI codes
Running codes compiled with “-g” and that MPI will allow you to dig in further to MPI layer issues (set: ulimit -c unlimited , in your shell to enable core file generation):
[arnoldg@dt-login02 collective]$ gdb osu_ireduce core.osu*
...
(gdb) where
#0  0x00007fa1de84b89c in ompi_coll_libnbc_progress () at ../../../../opal/class/opal_list.h:451
#1  0x00007fa1ed15a463 in opal_progress () at runtime/opal_progress.c:231
#2  0x00007fa1ee684735 in ompi_request_wait_completion (req=0x1749b80) at ../ompi/request/request.h:440
#3  ompi_request_default_wait (req_ptr=0x7fff36b54528, status=0x7fff36b54530) at request/req_wait.c:42
#4  0x00007fa1ee6eef24 in ompi_coll_base_sendrecv_zero (stag=-16, rtag=-16, comm=0x6115a0 <ompi_mpi_comm_world>,
    source=1, dest=1) at base/coll_base_barrier.c:64
#5  ompi_coll_base_barrier_intra_recursivedoubling (comm=0x6115a0 <ompi_mpi_comm_world>, module=<optimized out>)
    at base/coll_base_barrier.c:219
#6  0x00007fa1ee69ceb8 in PMPI_Barrier (comm=0x6115a0 <ompi_mpi_comm_world>,
    comm@entry=<error reading variable: dwarf2_find_location_expression: Corrupted DWARF expression.>)
    at pbarrier.c:74
#7  PMPI_Barrier (comm=0x6115a0 <ompi_mpi_comm_world>) at pbarrier.c:40
#8  0x000000000040285c in main (argc=4, argv=0x7fff36b547f8) at osu_ireduce.c:169
(gdb)
Debugging Open OnDemand Problems
Go to Debugging Open OnDemand.