Monitoring a Node During a Job
You have SSH access to nodes in your running job(s). Some of the basic monitoring tools are demonstrated in the example transcript below. Screen shots are appended so that you can see the output from the tools. Most common Linux utilities are available from the compute nodes (free, strace, ps, and so on).
[arnoldg@dt-login03 python]$ squeue -u $USER
JOBID PARTITION NAME USER ST TIME NODES NODELIST(REASON)
1214412 gpuA40x4- interact arnoldg R 8:14 1 gpub045
[arnoldg@dt-login03 python]$ ssh gpub045
gpub045.delta.internal.ncsa.edu (141.142.145.145)
OS: RedHat 8.4 HW: HPE CPU: 64x RAM: 252 GB
Last login: Wed Dec 14 09:45:26 2022 from 141.142.144.42
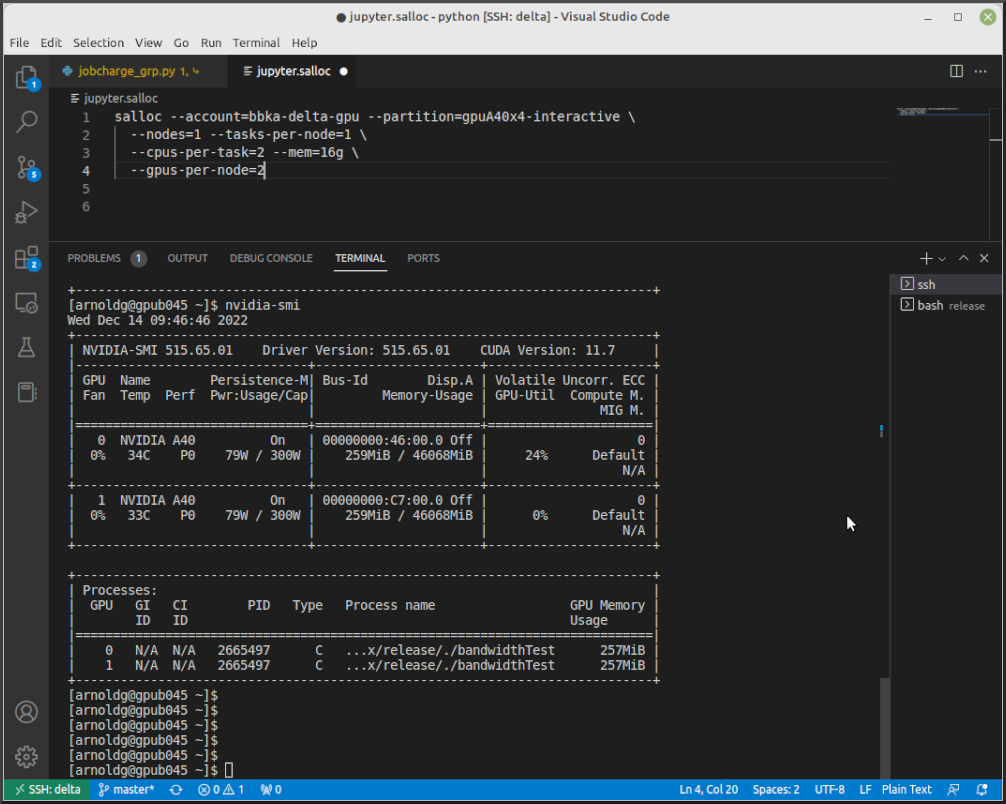
[arnoldg@gpub045 ~]$ nvidia-smi
[arnoldg@gpub045 ~]$ module load nvtop
---------------------------------------------------------------------------------------------------------------------
The following dependent module(s) are not currently loaded: cuda/11.6.1 (required by: ucx/1.11.2, openmpi/4.1.2)
---------------------------------------------------------------------------------------------------------------------
The following have been reloaded with a version change:
1) cuda/11.6.1 => cuda/11.7.0
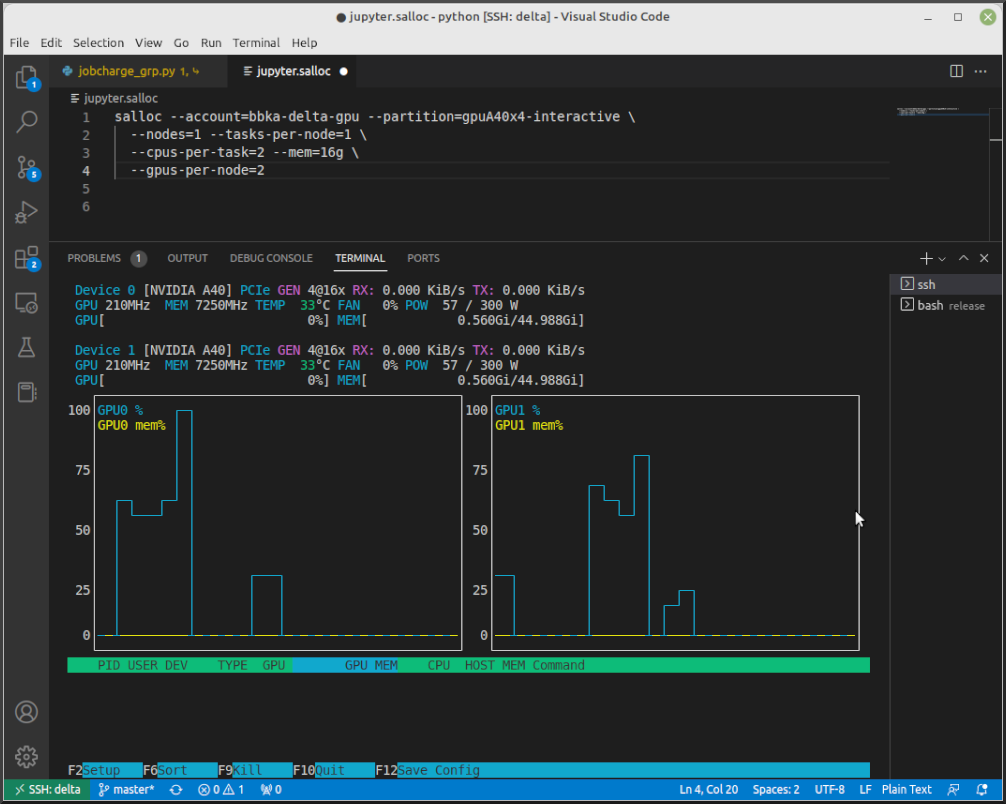
[arnoldg@gpub045 ~]$ nvtop
[arnoldg@gpub045 ~]$ module load anaconda3_gpu
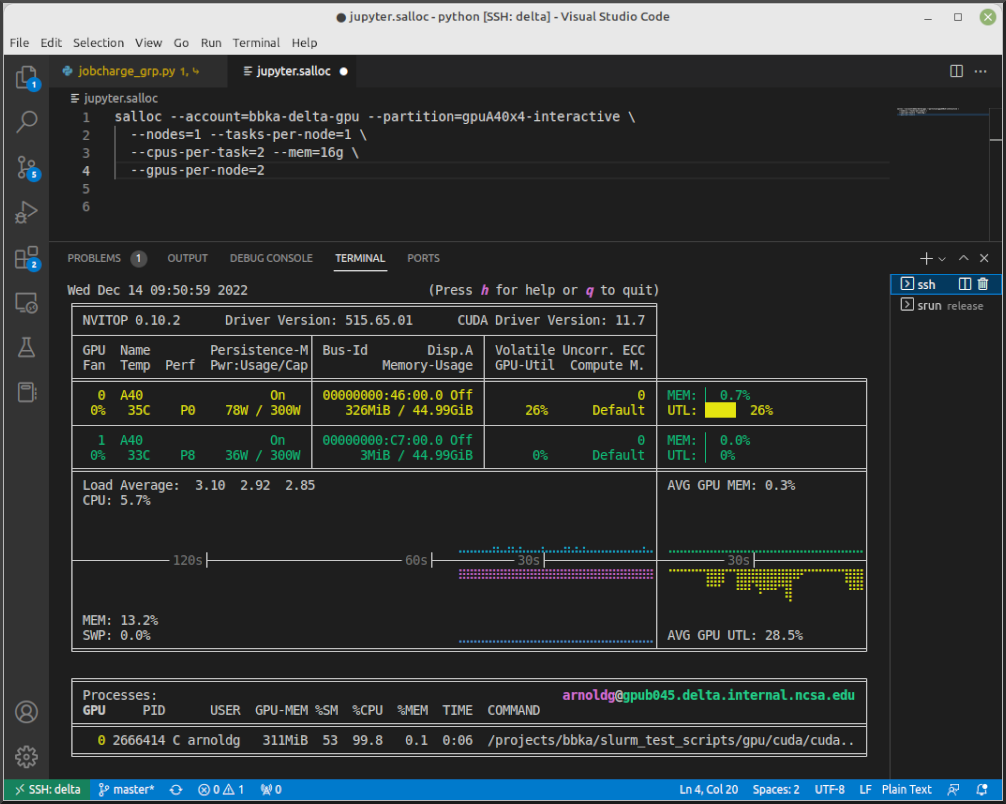
[arnoldg@gpub045 ~]$ nvitop
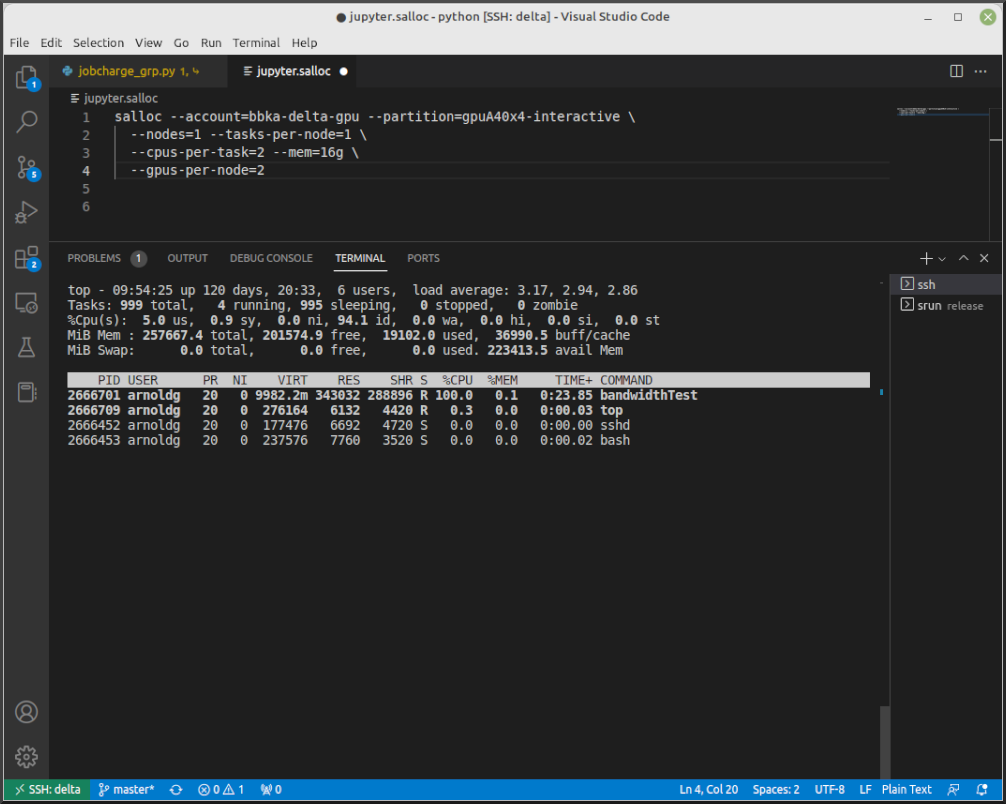
[arnoldg@gpub045 ~]$ top -u $USER
nvidia-smi
NVIDIA System Management Interface (nvidia-smi) is a utility for GPUs.
nvtop
nvtop is an interactive GPU process viewer.
nvitop
nvitop is an interactive GPU process viewer.
top -u $USER
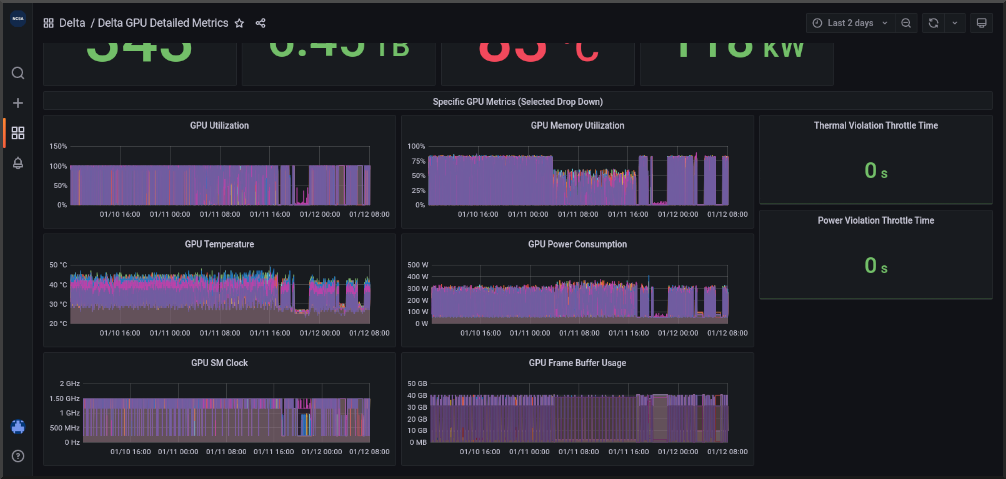
Grafana
Monitor node metrics using Grafana.
Navigate to: https://metrics.ncsa.illinois.edu
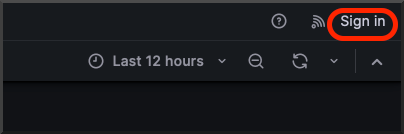
Sign in (top-right).
Navigate to the metrics of interest.
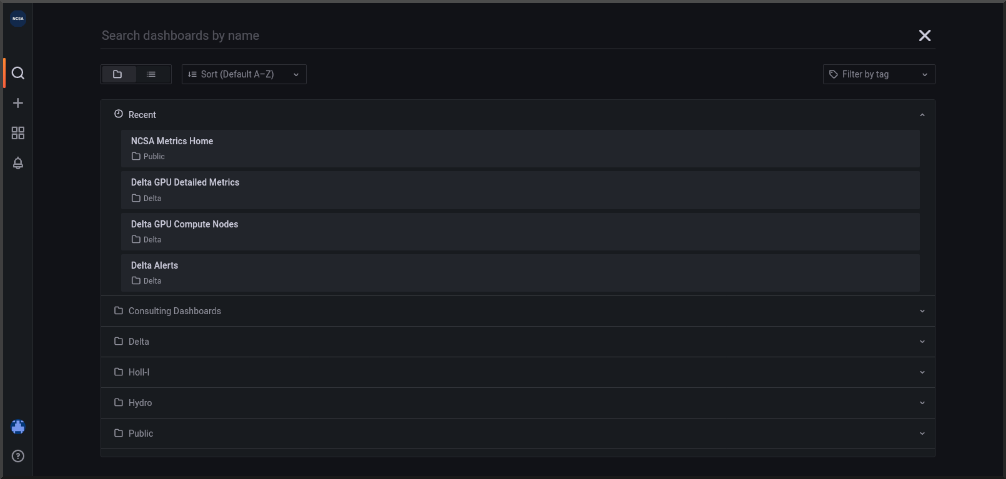
You may choose a node from the list of nodes and get detailed information in real time.