Debugging and Performance Analysis
Performance tools
Examples and srun/slurm commands are yet to be tested for the following, but all of the options below are thought to be workable on the system.
Tools that access hardware counters on the NVIDIA GPU, or CPU need to add an additional Slurm directive.
For CPU jobs, add
--constraint=perf# this will make the job node-excluse (whole node jobs only)For GPU jobs, add
--constraint=nvperf# can get counters in node-shared mode if cpu counters are not also needed
Cray Performance and Analysis Tools
Cray Performance and Analysis Tools documentation.
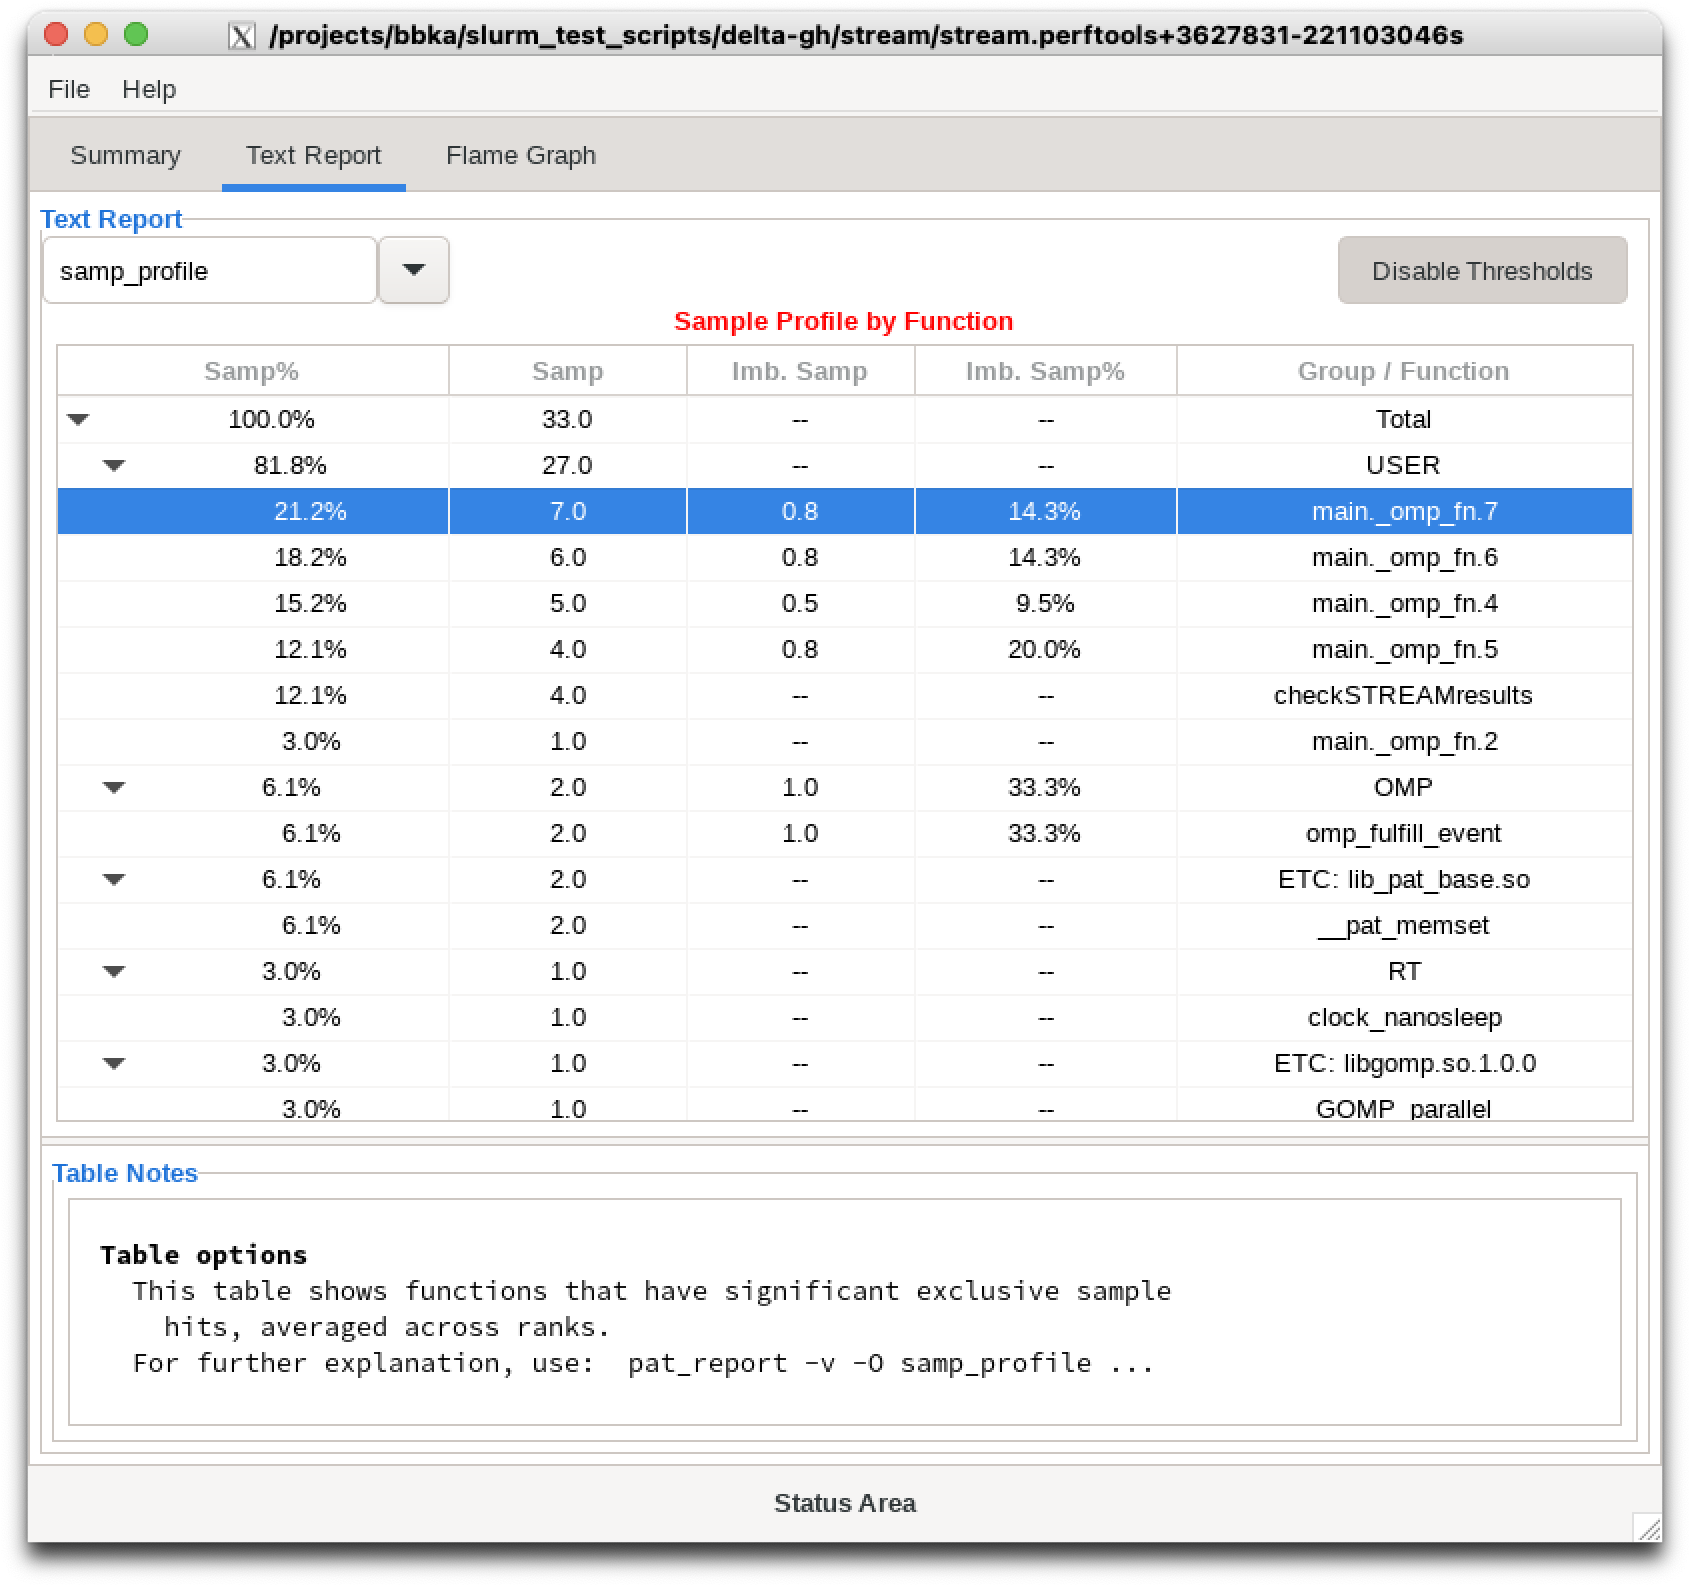
This example shows perftools-lite with the stream benchmark code.
# load modules and rebuild application
$ module load perftools-base perftools-lite
$ cc -DNTIMES=1000 -g stream.c
 WARNING: PerfTools is saving object files from a temporary directory into directory '/u/arnoldg/.craypat/a.out/3228435'
 INFO: creating the PerfTools-instrumented executable 'a.out' (lite-samples) ...OK

# start a job allocation with salloc, run a test job instrumented with perftools-lite
$ salloc \
  --mem=128g \
  --nodes=1 \
  --ntasks-per-node=1 \
  --cpus-per-task=32 \
  --time=00:30:00 \
  --job-name=perftools-test \
  --account=bbka-dtai-gh \
  --gpus-per-node=1
$ OMP_NUM_THREADS=4 srun stream.perftools
CrayPat/X:  Version 24.07.0 Revision 5768411af sles15.5_aarch64  06/07/24 21:08:09
pat[WARNING][0]: GH200 GPU support is experimental and is provided as beta support only. Unexpected behavior can occur in user code
...
Function    Best Rate MB/s  Avg time     Min time     Max time
Copy:           29766.6     0.005727     0.005375     0.006014
Scale:          29525.7     0.005558     0.005419     0.005808
Add:            38449.0     0.006287     0.006242     0.006311
Triad:          39860.3     0.006036     0.006021     0.006047
-------------------------------------------------------------
Solution Validates: avg error less than 1.000000e-13 on all three arrays
-------------------------------------------------------------
#################################################################
#                                                               #
#            CrayPat-lite Performance Statistics                #
#                                                               #
#################################################################

CrayPat/X:  Version 24.07.0 Revision 5768411af sles15.5_aarch64  06/07/24 21:08:09
Experiment:                  lite  lite-samples
Number of PEs (MPI ranks):      1
Numbers of PEs per Node:        1
Numbers of Threads per PE:      4
Number of Cores per Socket:    72
Accelerator Model: Nvidia GH200-120GB; Memory: 120.00 GB; Frequency: 1.53 GHz

Execution start time:  Mon Jan 27 11:40:56 2025
System name and speed:
  gh067.hsn.cm.delta.internal.ncsa.edu  3.384 GHz (nominal)
Nvidia Grace                CPU

Avg Process Time:            0.36 secs
High Memory:                247.6 MiBytes     247.6 MiBytes per PE
Percent cycles stalled:      68.7 %
Instr per Cycle:             2.48
I/O Read Rate:                 -- MiBytes/sec
I/O Write Rate:         30.010008 MiBytes/sec

Notes for table 1:

  This table shows functions that have significant exclusive sample
    hits, averaged across ranks.
  For further explanation, use:  pat_report -v -O samp_profile ...

Table 1:  Sample Profile by Function
Table 1:  Sample Profile by Function

  Samp% | Samp | Imb. |  Imb. | Group
        |      | Samp | Samp% |  Function=[MAX10]
        |      |      |       |   Thread=HIDE

 100.0% | 33.0 |   -- |    -- | Total
|----------------------------------------------------
|  81.8% | 27.0 |   -- |    -- | USER
||---------------------------------------------------
||  21.2% |  7.0 |  0.8 | 14.3% | main._omp_fn.7
||  18.2% |  6.0 |  0.8 | 14.3% | main._omp_fn.6
||  15.2% |  5.0 |  0.5 |  9.5% | main._omp_fn.4
||  12.1% |  4.0 |  0.8 | 20.0% | main._omp_fn.5
||  12.1% |  4.0 |   -- |    -- | checkSTREAMresults
||   3.0% |  1.0 |   -- |    -- | main._omp_fn.2
||===================================================
|   6.1% |  2.0 |  1.0 | 33.3% | OMP
||---------------------------------------------------
||   6.1% |  2.0 |  1.0 | 33.3% | omp_fulfill_event
||===================================================
|   6.1% |  2.0 |   -- |    -- | ETC: lib_pat_base.so
||---------------------------------------------------
||   6.1% |  2.0 |   -- |    -- | __pat_memset
||===================================================
|   3.0% |  1.0 |   -- |    -- | RT
||---------------------------------------------------
||   3.0% |  1.0 |   -- |    -- | clock_nanosleep
||===================================================
|   3.0% |  1.0 |   -- |    -- | ETC: libgomp.so.1.0.0
||---------------------------------------------------
||   3.0% |  1.0 |   -- |    -- | GOMP_parallel
|====================================================
...
For a complete report with expanded tables and notes, run:
  pat_report /projects/bbka/slurm_test_scripts/delta-gh/stream/stream.perftools+3627831-221103046s

For help identifying callers of particular functions:
  pat_report -O callers+src /projects/bbka/slurm_test_scripts/delta-gh/stream/stream.perftools+3627831-221103046s
To see the entire call tree:
  pat_report -O calltree+src /projects/bbka/slurm_test_scripts/delta-gh/stream/stream.perftools+3627831-221103046s

For interactive, graphical performance analysis, run:
  app2 /projects/bbka/slurm_test_scripts/delta-gh/stream/stream.perftools+3627831-221103046s

================  End of CrayPat-lite output  ==========================
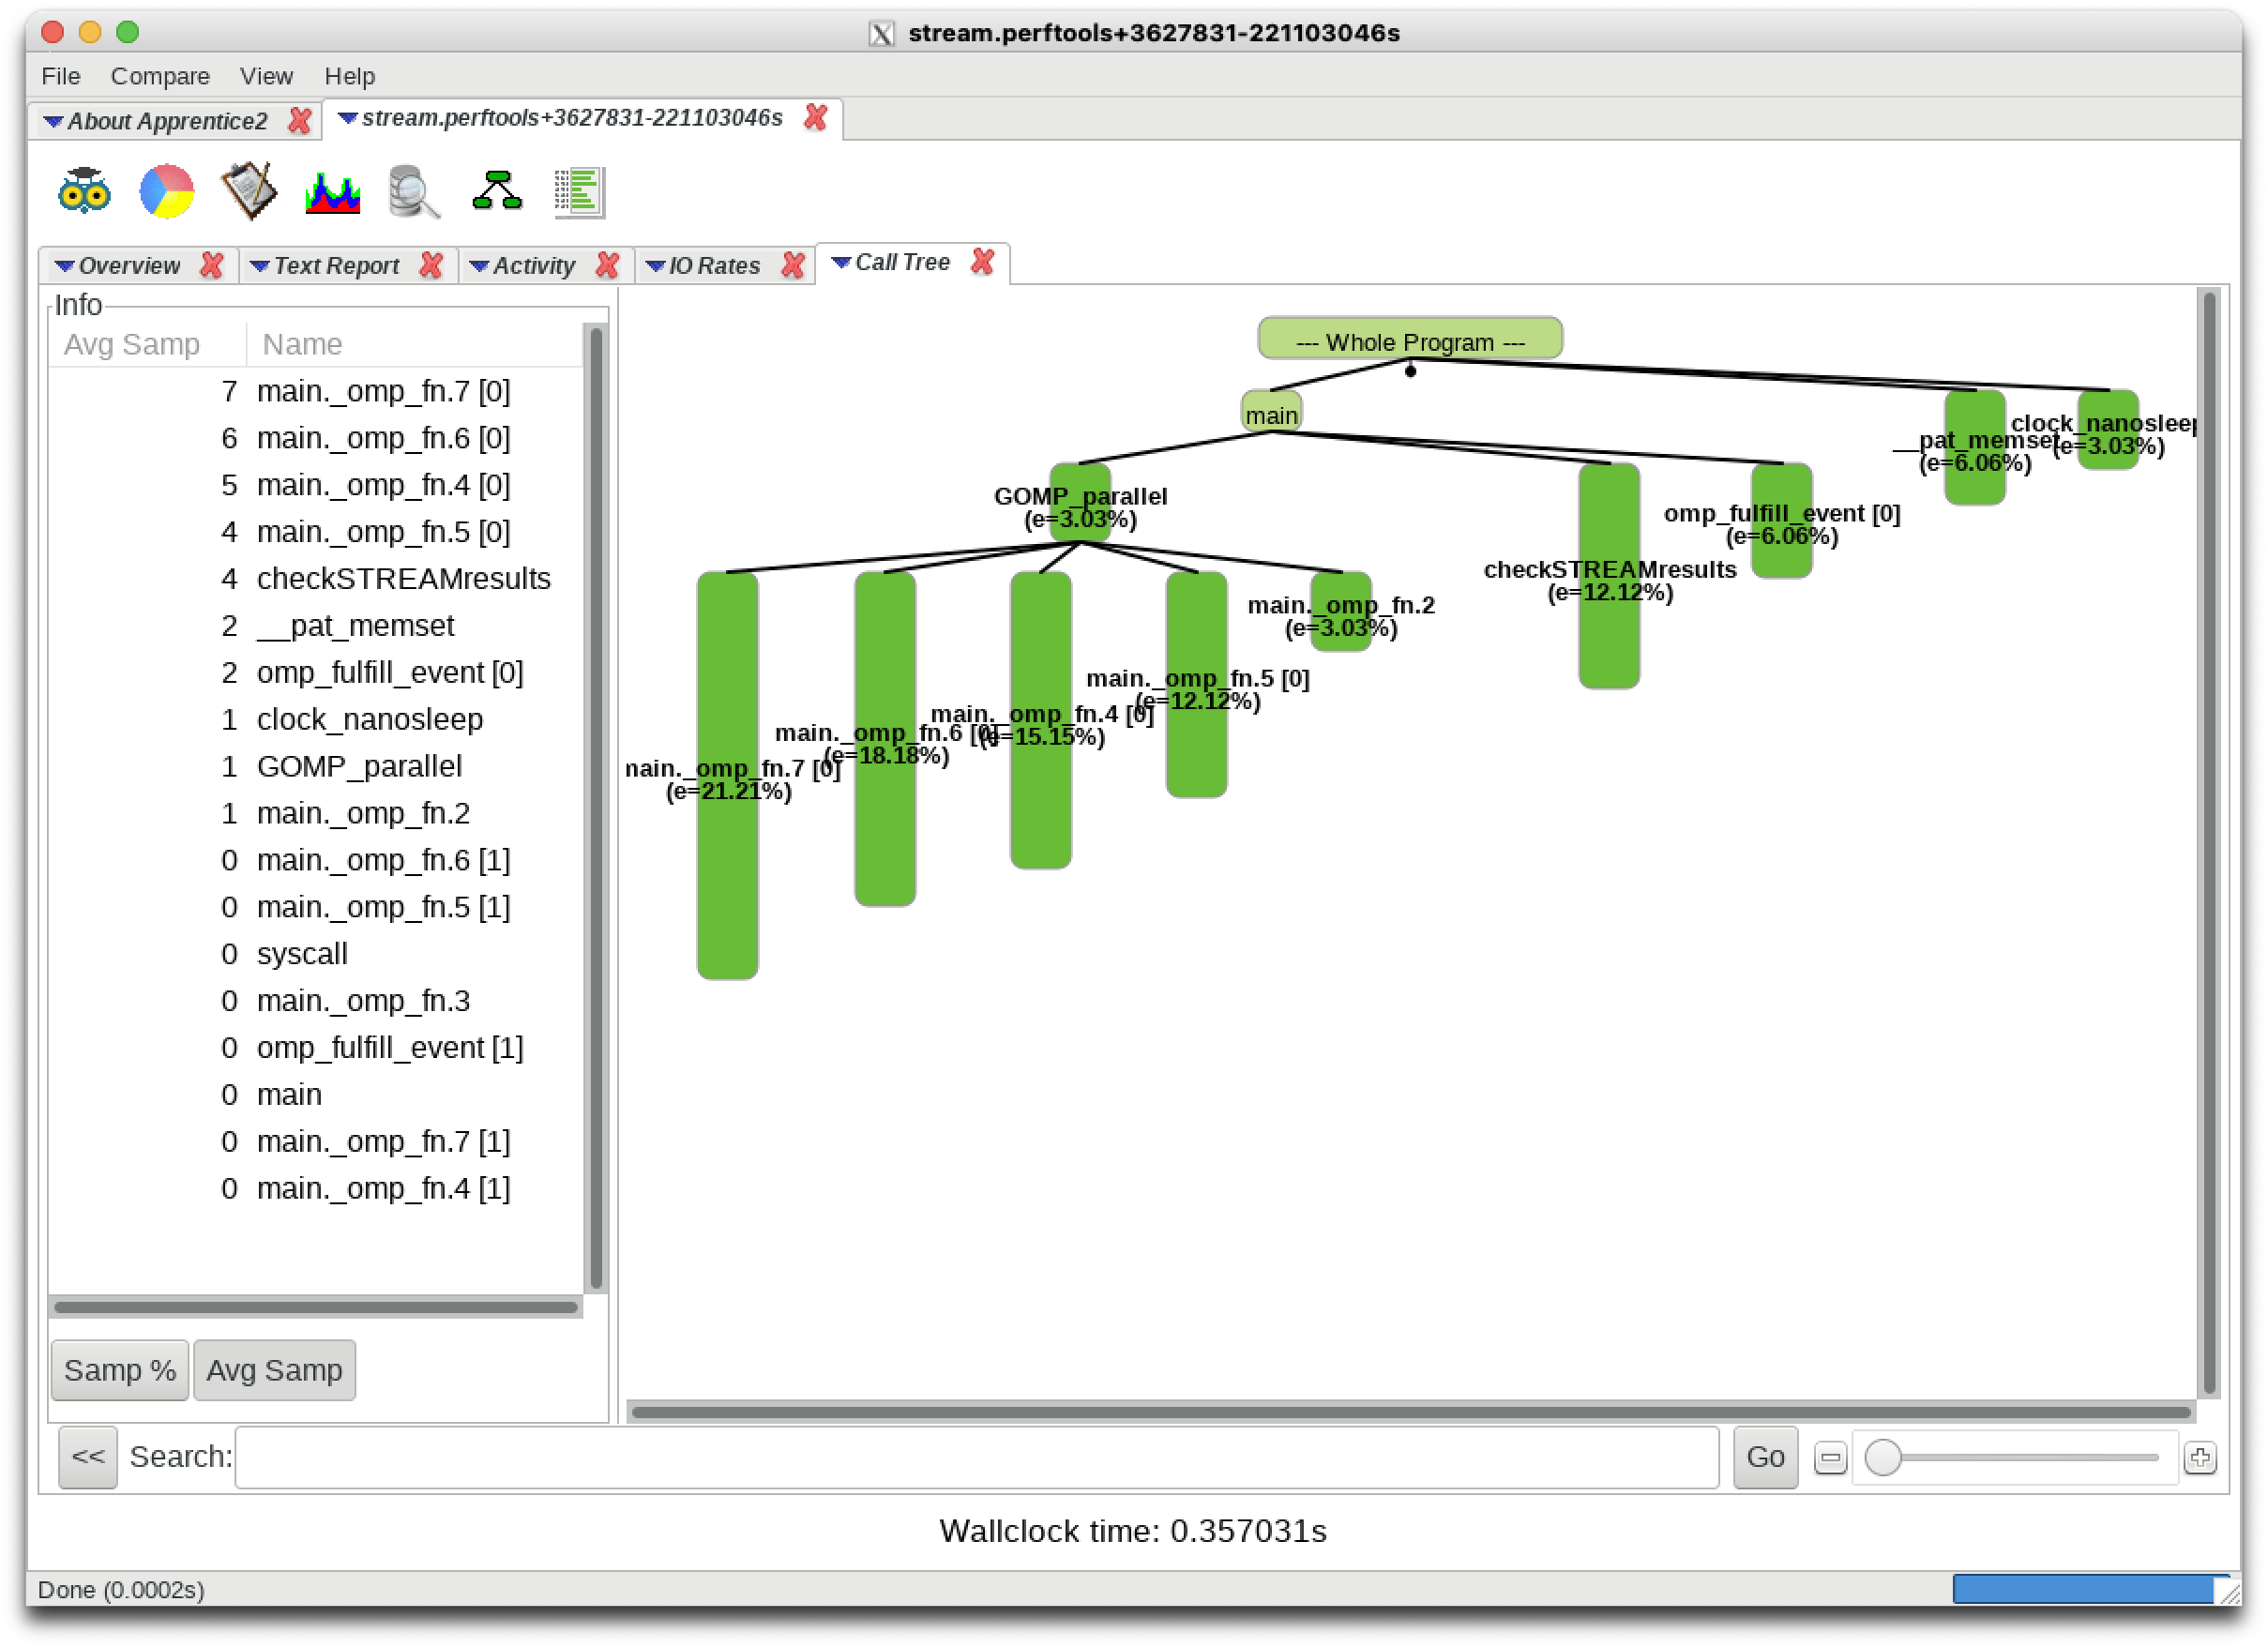
Cray Apprentice2 Apprentice 3 (app2, app3)
Cray Apprentice 3 documentation.
The Apprentice GUI viewers simplify exploring the output from a perftools experiment (perftools-lite).
- Apprentice 3:
- Apprentice2:
Nvidia Nsight Systems
Installation (NVIDIA Nsight Systems Client on Local Desktop/Laptop)
Open the NVIDIA developer tools overview and navigate to the Developer Tools Downloads button.
Select Nsight Systems and your operating system. If you do not have an account at developer.nvidia.com, set one up when prompted. When you have completed the forms, your download will begin.
Install the application on your local machine. You may download output files from command line application and use the GUI locally on your laptop (use scp or globus online).
Run your application on DeltaAI with the Slurm constraint --constraint=nvperf, the following is a sample srun (from an salloc allocation) using nsys to profile and collect data.
arnoldg@gh-login01:/projects/bbka/slurm_test_scripts/delta-gh/cuda/cuda-samples/bin/sbsa/linux/release> srun nsys profile --stats=true \
  ./bandwidthTest
[CUDA Bandwidth Test] - Starting...
Running on...

 Device 0: NVIDIA GH200 120GB
 Quick Mode

 Host to Device Bandwidth, 1 Device(s)
 PINNED Memory Transfers
   Transfer Size (Bytes)        Bandwidth(GB/s)
   32000000                     387.8

 Device to Host Bandwidth, 1 Device(s)
 PINNED Memory Transfers
   Transfer Size (Bytes)        Bandwidth(GB/s)
   32000000                     167.2

 Device to Device Bandwidth, 1 Device(s)
 PINNED Memory Transfers
   Transfer Size (Bytes)        Bandwidth(GB/s)
   32000000                     2190.1

Result = PASS

NOTE: The CUDA Samples are not meant for performance measurements. Results may vary when GPU Boost is enabled.
Generating '/tmp/nsys-report-465c.qdstrm'
[1/8] [========================100%] report2.nsys-rep
[2/8] [========================100%] report2.sqlite
SKIPPED: /projects/bbka/slurm_test_scripts/delta-gh/cuda/cuda-samples/bin/sbsa/linux/release/report2.sqlite does not contain NV Tools Extension (NVTX) data.
SKIPPED: /projects/bbka/slurm_test_scripts/delta-gh/cuda/cuda-samples/bin/sbsa/linux/release/report2.sqlite does not contain CUDA kernel data.
[3/8] Executing 'nvtx_sum' stats report
[4/8] Executing 'osrt_sum' stats report

 Time (%)  Total Time (ns)  Num Calls    Avg (ns)      Med (ns)    Min (ns)   Max (ns)    StdDev (ns)            Name
 --------  ---------------  ---------  ------------  ------------  --------  -----------  ------------  ----------------------
     63.6      611,605,600         17  35,976,800.0  14,062,912.0     1,216  109,818,336  41,367,381.1  poll
     35.7      343,106,208        826     415,382.8      22,096.0     1,120   21,060,512   1,362,769.2  ioctl
      0.1        1,425,408          4     356,352.0     347,616.0   328,704      401,472      31,792.8  pthread_create
      0.1        1,374,944         42      32,736.8      15,952.0     2,528      263,776      61,734.8  mmap
...

[5/8] Executing 'cuda_api_sum' stats report

 Time (%)  Total Time (ns)  Num Calls   Avg (ns)     Med (ns)    Min (ns)    Max (ns)   StdDev (ns)                Name
 --------  ---------------  ---------  -----------  -----------  ---------  ----------  -----------  ---------------------------------
     55.5       29,565,536          3  9,855,178.7  8,095,168.0  2,479,552  18,990,816  8,395,158.6  cudaDeviceSynchronize
     18.0        9,580,448          4  2,395,112.0  2,210,128.0  1,333,440   3,826,752  1,138,482.7  cudaMalloc
      8.7        4,631,936          3  1,543,978.7  1,479,648.0  1,417,728   1,734,560    167,926.9  cudaHostAlloc
      6.6        3,542,528          4    885,632.0    839,152.0    223,232   1,640,992    583,754.5  cudaFree
      4.7        2,516,768          1  2,516,768.0  2,516,768.0  2,516,768   2,516,768          0.0  cudaGetDeviceProperties_v2_v12000
...


[6/8] Executing 'cuda_gpu_kern_sum' stats report
[7/8] Executing 'cuda_gpu_mem_time_sum' stats report

 Time (%)  Total Time (ns)  Count  Avg (ns)   Med (ns)   Min (ns)  Max (ns)  StdDev (ns)            Operation
 --------  ---------------  -----  ---------  ---------  --------  --------  -----------  ------------------------------
     63.1       18,978,017    100  189,780.2  189,664.0   189,376   190,400        290.9  [CUDA memcpy Device-to-Host]
     27.7        8,323,328    102   81,601.3   80,592.0    79,616   119,616      6,000.2  [CUDA memcpy Host-to-Device]
      9.2        2,780,608    100   27,806.1   27,952.0    26,752    29,216        564.7  [CUDA memcpy Device-to-Device]

[8/8] Executing 'cuda_gpu_mem_size_sum' stats report

 Total (MB)  Count  Avg (MB)  Med (MB)  Min (MB)  Max (MB)  StdDev (MB)            Operation
 ----------  -----  --------  --------  --------  --------  -----------  ------------------------------
  3,264.000    102    32.000    32.000    32.000    32.000        0.000  [CUDA memcpy Host-to-Device]
  3,200.000    100    32.000    32.000    32.000    32.000        0.000  [CUDA memcpy Device-to-Device]
  3,200.000    100    32.000    32.000    32.000    32.000        0.000  [CUDA memcpy Device-to-Host]

Generated:
    /projects/bbka/slurm_test_scripts/delta-gh/cuda/cuda-samples/bin/sbsa/linux/release/report2.nsys-rep
    /projects/bbka/slurm_test_scripts/delta-gh/cuda/cuda-samples/bin/sbsa/linux/release/report2.sqlite
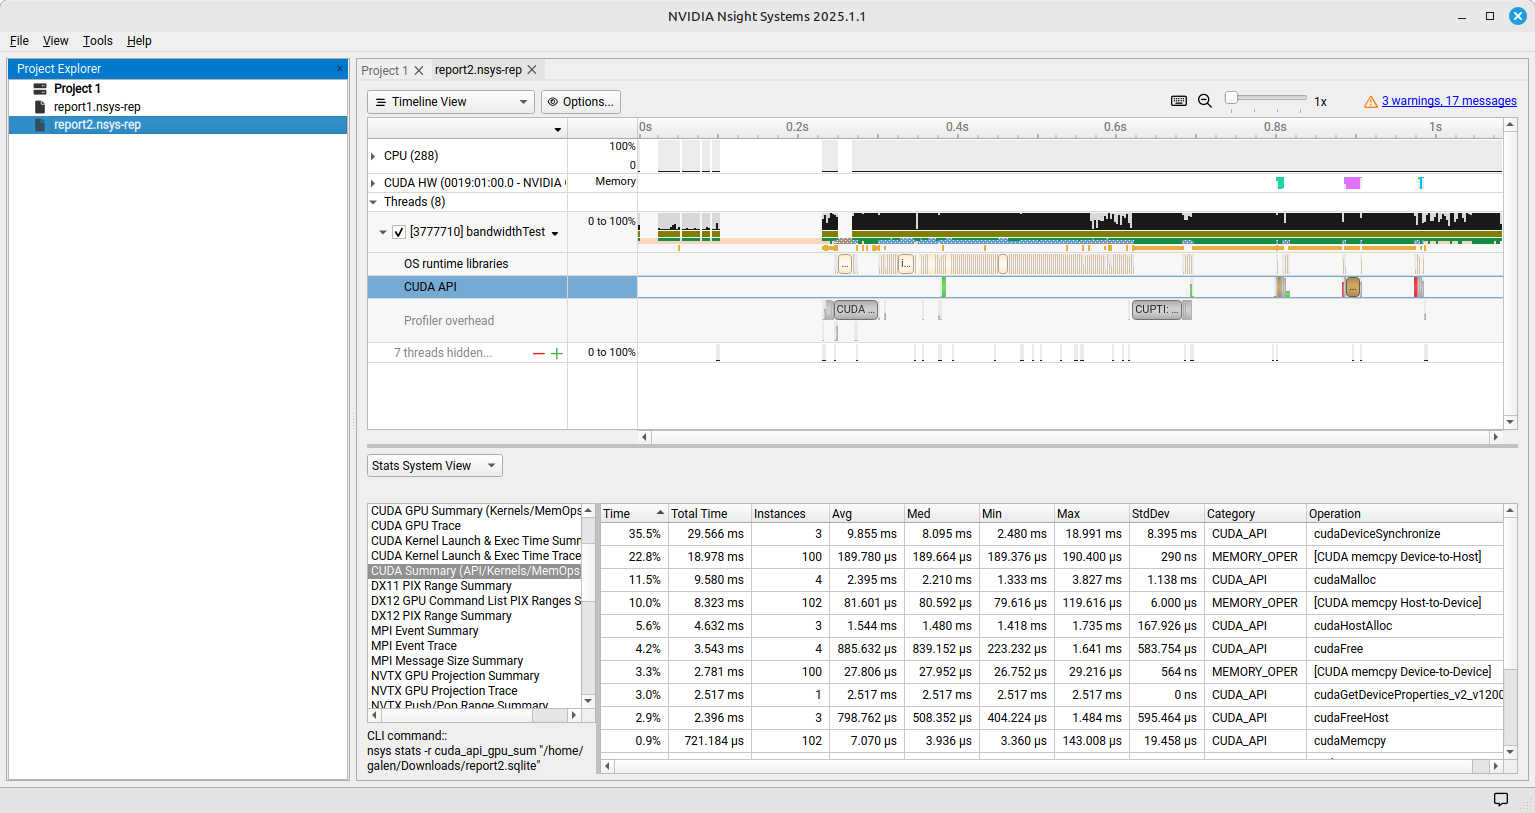
Nsight view
After transfering the .nsys-rep and .sqlite file to your local computer, use Nsight to view and explore the data in the files.
Linux Perf performance counting
The linux perf subsystem can access hardware performance counters and summarize them per application execution.
Refer to the perf: Linux profiling with performance counters documentation.
$ srun -n 1 perf stat ./stream
...
Function    Best Rate MB/s  Avg time     Min time     Max time
Copy:          209715.2     0.000776     0.000763     0.000844
Scale:         217391.8     0.000750     0.000736     0.000781
Add:           306433.2     0.000790     0.000783     0.000818
Triad:         319667.5     0.000761     0.000751     0.000827
-------------------------------------------------------------
Solution Validates: avg error less than 1.000000e-13 on all three arrays
-------------------------------------------------------------

 Performance counter stats for './stream':

          1,123.76 msec task-clock:u                     #   13.879 CPUs utilized
                 0      context-switches:u               #    0.000 /sec
                 0      cpu-migrations:u                 #    0.000 /sec
             3,790      page-faults:u                    #    3.373 K/sec
     3,529,675,530      cycles:u                         #    3.141 GHz
     9,296,279,435      instructions:u                   #    2.63  insn per cycle
   <not supported>      branches:u
            21,799      branch-misses:u

       0.080967055 seconds time elapsed

       0.872424000 seconds user
       0.279514000 seconds sys
Linux/Unix gprof
gprof generates a sampling profile of function calls in a program. It’s a good general purpose command-line profiler to use when getting started and it has low overhead.
See:
Linux/Unix strace
strace will trace or summarize system call activity for a program (the portion of time going to system due to i/o, networking, memory allocations or anything else provided by the kernel to the executing code).
See the strace documentation.
$ srun -n 1 strace -c ./stream
...
Triad:         319566.0     0.000774     0.000751     0.000788
-------------------------------------------------------------
Solution Validates: avg error less than 1.000000e-13 on all three arrays
-------------------------------------------------------------
% time     seconds  usecs/call     calls    errors syscall
------ ----------- ----------- --------- --------- -----------------------
 71.11    0.003281         105        31           clone
 11.75    0.000542           4       115       105 openat
  4.23    0.000195           4        41           mprotect
  4.16    0.000192           3        56        49 newfstatat
  3.53    0.000163           3        49           mmap
...
mpiP MPI profiling
mpiP is a light-weight profiling library for MPI. It collects statistical information about MPI functions and has very little overhead.
See the mpiP GitHub repository.
$ module load mpip
$ srun a.out
$ more ./a.out.4.3112547.1.mpiP
@ mpiP
@ Command : osu_ireduce
@ Version                  : 3.5.0
@ MPIP Build date          : Feb  6 2025, 12:00:55
@ Start time               : 2025 02 06 13:03:27
@ Stop time                : 2025 02 06 13:03:28
@ Timer Used               : PMPI_Wtime
@ MPIP env var             : [null]
@ Collector Rank           : 0
@ Collector PID            : 3112547
@ Final Output Dir         : .
@ Report generation        : Single collector task
@ MPI Task Assignment      : 0 gh029.hsn.cm.delta.internal.ncsa.edu
@ MPI Task Assignment      : 1 gh029.hsn.cm.delta.internal.ncsa.edu
@ MPI Task Assignment      : 2 gh029.hsn.cm.delta.internal.ncsa.edu
@ MPI Task Assignment      : 3 gh029.hsn.cm.delta.internal.ncsa.edu

---------------------------------------------------------------------------
@--- MPI Time (seconds) ---------------------------------------------------
---------------------------------------------------------------------------
Task    AppTime    MPITime     MPI%
   0      0.683       0.43    63.01
   1      0.683       0.46    67.29
   2      0.683      0.461    67.53
   3      0.683      0.474    69.36
   *       2.73       1.83    66.80
...
Python cProfile Profiler
Run your script with cProfile externally, or use it to profile individual functions. The following example uses an existing salloc allocation and a single GPU on a compute node.
See the Python Profilers documentation.
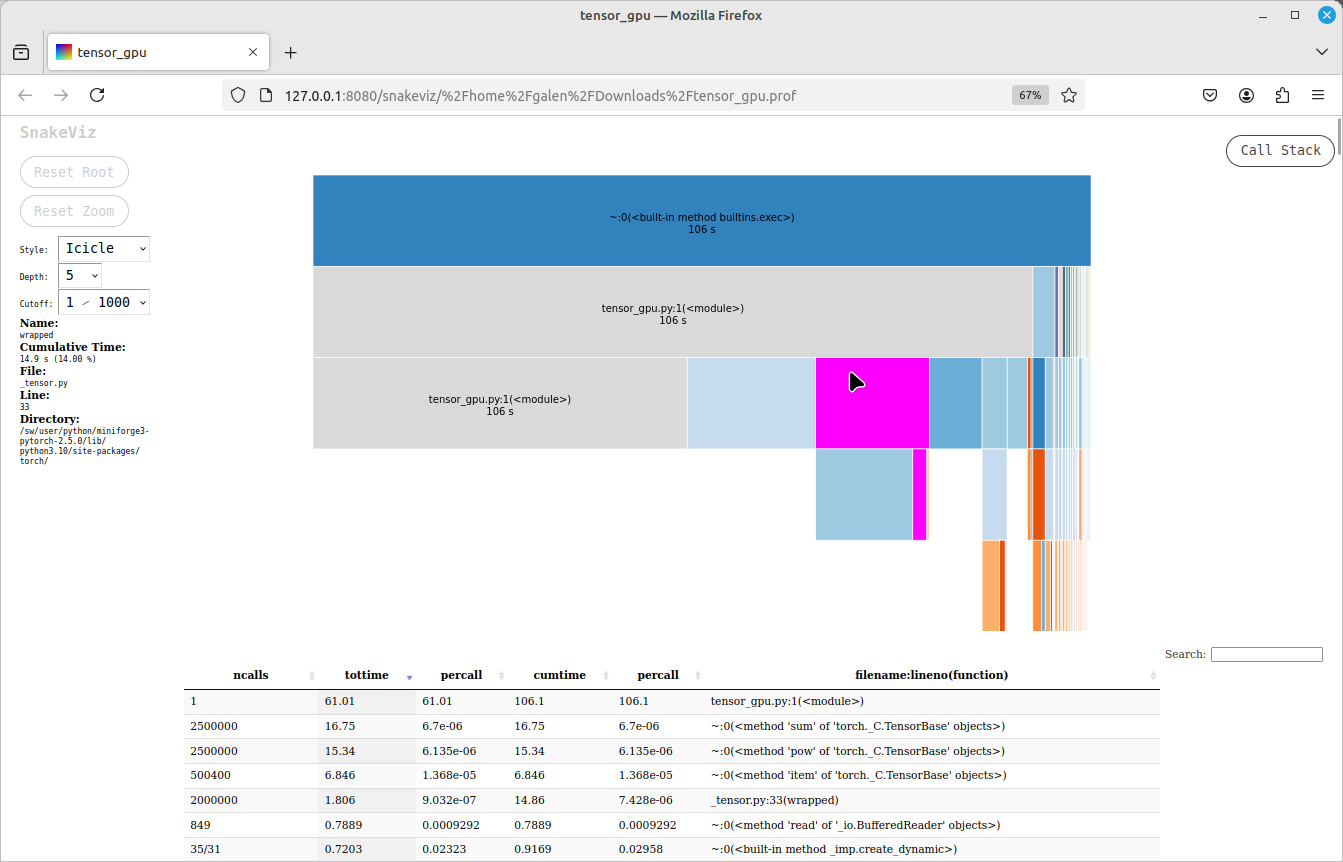
$ srun python3 -m cProfile -o tensor_gpu.prof tensor_gpu.py
If you generated a profiling output file (tensor_gpu.prof in the example above), you can visualize and explore it using the SnakeViz tool on a local desktop python installation (pip or conda install snakeviz on your local system).
Debugging tools
Tools below have not yet been tested on the system but are thought to be functional (modules are present).
Cray Debugging Support Tools documentation.
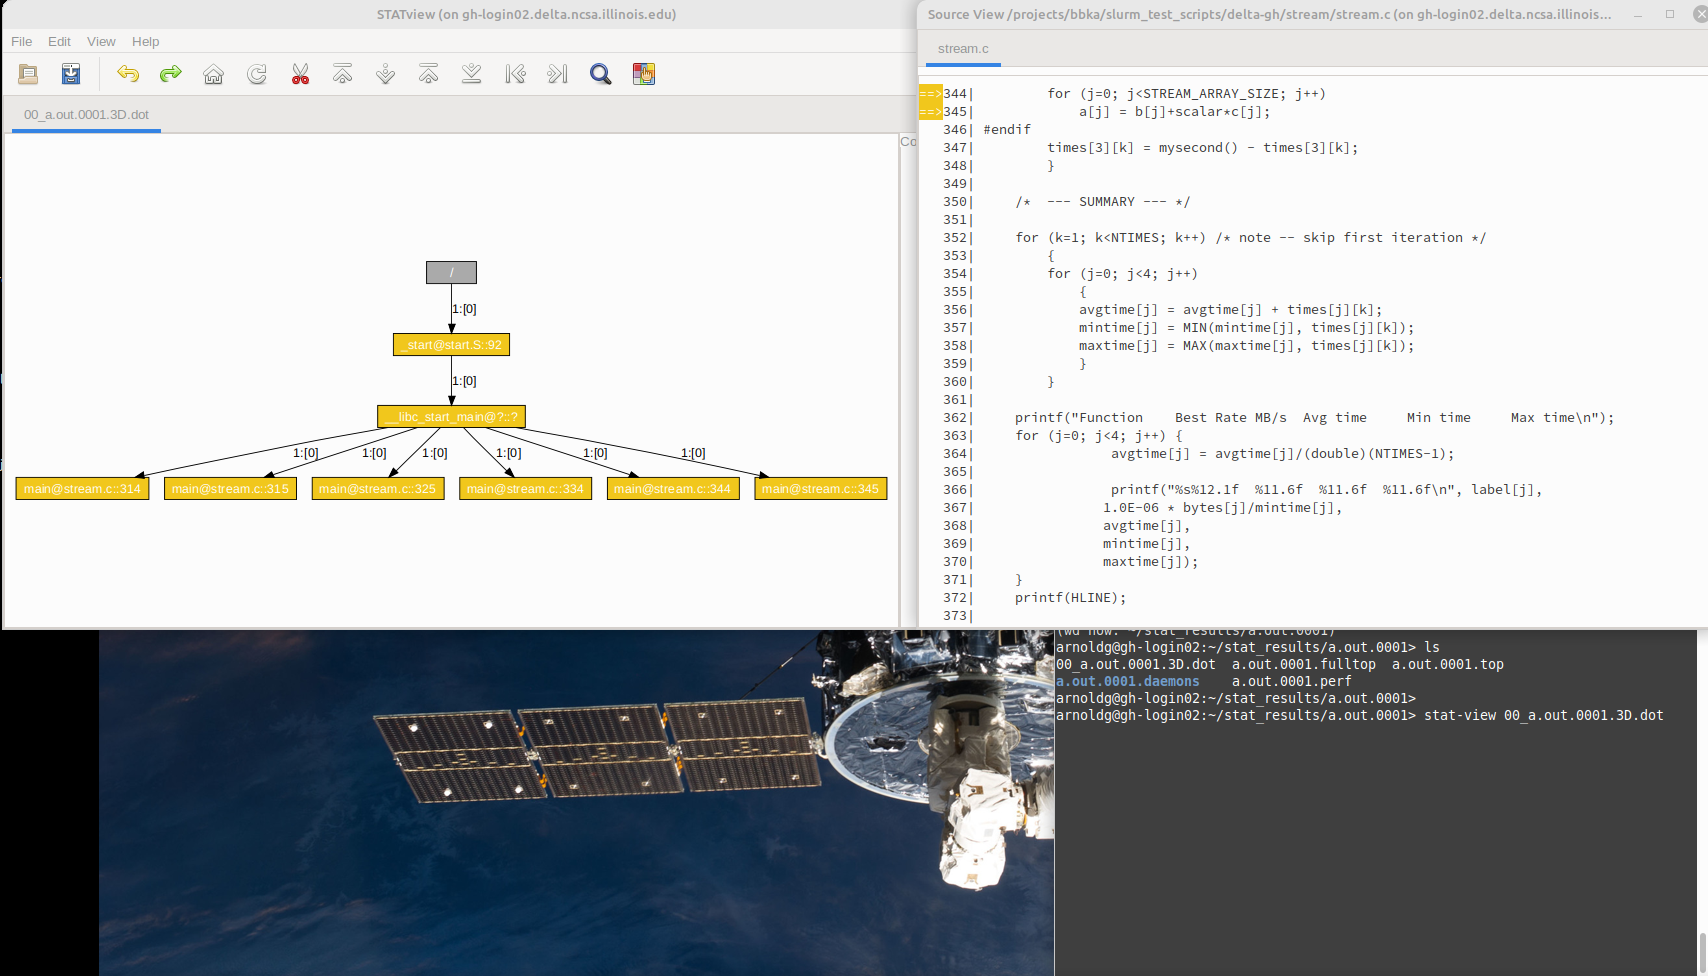
STAT
Stat can be used to inspect a running application to see where the code is currently executing, it does not stop the application.
This example shows stat-cl attaching to a running application (started with salloc/srun):
arnoldg@gh-login02:~> module load cray-stat
arnoldg@gh-login02:~> ps -u $USER
    PID TTY          TIME CMD
...
1437964 pts/50   00:00:00 srun
1437965 pts/50   00:00:00 srun
1446356 pts/66   00:00:00 ps
arnoldg@gh-login02:~> stat-cl -i -a 1437964
STAT started at 2025-01-24-13:20:38
Attaching to job launcher (null):1437964 and launching tool daemons...
Tool daemons launched and connected!
Attaching to application...
...
Merging traces...
Traces merged!
Detaching from application...
Detached!

Results written to /u/arnoldg/stat_results/a.out.0001
View the dot files with stat-view. This example shows the source code from the collection above after selecting a box at the bottom of the call tree and view source.
gdb4hpc
The following example steps through getting a gdb4hpc debug session running:
Load the module. Make sure your code is built with
-gfor debug symbols and line numbering. Then get a job allocation withsalloc.$ module load gdb4hpc $ cc -g mympiapp.c $ salloc \ --mem=16g \ --nodes=2 \ --ntasks-per-node=8 \ --cpus-per-task=1 \ --time=00:50:00 \ --job-name=debug \ --account=bbka-dtai-gh \ --gpus-per-node=1 salloc: Granted job allocation 423691 salloc: Waiting for resource configuration salloc: Nodes gh[044-045] are ready for job
Start gdb4hpc. At this time there’s an issue with the command and our
$HOME, so reset HOME to another shared space (/work/...in this example). Use thelaunchcommand within gdb4hpc to launch and attach to your program. The{n}syntax with launch is required and enumerates the number of MPI ranks to start with gdb4hpc.$ HOME=/work/hdd/bbka/arnoldg gdb4hpc gdb4hpc 4.16.2 - Cray Interactive Parallel Debugger With Cray Comparative Debugging Technology. Copyright 2007-2023 Hewlett Packard Enterprise Development LP. Copyright 1996-2016 University of Queensland. All Rights Reserved. Type "help" for a list of commands. Type "help <cmd>" for detailed help about a command. dbg all> dbg all> launch $osu_ireduce{16} osu_ireduce Starting application, please wait... Launched application... 0/16 ranks connected... (timeout in 300 seconds) . 16/16 ranks connected Creating network... (timeout in 300 seconds) Created network... Connected to application... Launch complete. osu_ireduce{0..15}: Initial breakpoint, main at /u/arnoldg/osu-micro-benchmarks-7.4/c/mpi/collective/non_blocking/osu_ireduce.c:22 dbg all>At this point, you can debug the parallel application in the normal gdb manner. See the gdb4hpc man page for more information specific to the parallel debugger.
dbg all> break osu_ireduce.c:226
osu_ireduce{0..15}: Breakpoint 1: file /u/arnoldg/osu-micro-benchmarks7.4/c/mpi/collective/non_blocking/osu_ireduce.c, line 226.
dbg all> continue
<$osu_ireduce>: PE 2: Host gh044.hsn.cm.delta.internal.ncsa.edu selected NIC index=1, domain_name=cxi1,
numa_node=1, address=[0x70b2]
<$osu_ireduce>: PE 7: Host gh044.hsn.cm.delta.internal.ncsa.edu selected NIC index=3, domain_name=cxi3, numa_node=3, address=[0x7073]
<$osu_ireduce>: PE 0: Launcher/PMI did not supply NIC data (node_idx=0, rc=0, num_pmi_nics=0)
<$osu_ireduce>: PE 1: Host gh044.hsn.cm.delta.internal.ncsa.edu selected NIC index=0, domain_name=cxi0, numa_node=0, address=[0x7072]
...
<$osu_ireduce>: PE 0: MPICH CH4 OFI CXI counters initialized
<$osu_ireduce>:
<$osu_ireduce>: # OSU MPI Non-blocking Reduce Latency Test v7.4
<$osu_ireduce>: # Overall = Coll. Init + Compute + MPI_Test + MPI_Wait
<$osu_ireduce>:
<$osu_ireduce>: # Datatype: MPI_CHAR.
<$osu_ireduce>: # Size           Overall(us)       Compute(us)    Pure Comm.(us)        Overlap(%)
osu_ireduce{0..15}: Breakpoint 1, main at /u/arnoldg/osu-micro-benchmarks-7.4/c/mpi/collective/non_blocking/osu_ireduce.c:226
dbg all> list 226
osu_ireduce{0..15}: 221                     tcomp = 0.0;
osu_ireduce{0..15}: 222                     init_total = 0.0;
osu_ireduce{0..15}: 223                     wait_total = 0.0;
osu_ireduce{0..15}: 224                     test_time = 0.0, test_total = 0.0;
osu_ireduce{0..15}: 225
osu_ireduce{0..15}: 226                     for (i = 0; i < options.iterations + options.skip; i++) {
osu_ireduce{0..15}: 227                         root_rank = omb_get_root_rank(i, numprocs);
osu_ireduce{0..15}: 228                         if (options.validate) {
osu_ireduce{0..15}: 229                             set_buffer_validation(sendbuf, recvbuf, size, options.accel,
osu_ireduce{0..15}: 230                                                   i, omb_curr_datatype,
dbg all> next
osu_ireduce{0..15}: 227                 root_rank = omb_get_root_rank(i, numprocs);
dbg all> next
osu_ireduce{0..15}: 228                 if (options.validate) {
dbg all> next
osu_ireduce{0..15}: 243                 t_start = MPI_Wtime();
dbg all> next
osu_ireduce{0..15}: 244                 init_time = MPI_Wtime();
dbg all> print t_start
osu_ireduce{0}: 1122.766191053
osu_ireduce{1}: 1122.756754075
osu_ireduce{2}: 1122.76638375
osu_ireduce{3}: 1122.766183565
osu_ireduce{4}: 1122.766422277
osu_ireduce{5}: 1122.766237675
osu_ireduce{6}: 1122.766390566
osu_ireduce{7}: 1122.766434725
osu_ireduce{8}: 1122.758701815
osu_ireduce{9}: 1122.760867064
osu_ireduce{10}: 1122.763120918
osu_ireduce{11}: 1122.764748327
osu_ireduce{12}: 1122.765361845
osu_ireduce{13}: 1122.763713861
osu_ireduce{14}: 1122.766466453
osu_ireduce{15}: 1122.765510161
dbg all>
dbg all> continue
dbg all> <$osu_ireduce>: 1                       3.47              2.13              1.62             17.50
osu_ireduce{0..15}: Breakpoint 1, main at /u/arnoldg/osu-micro-benchmarks-7.4/c/mpi/collective/non_blocking/osu_ireduce.c:226
dbg all>
dbg all> quit
Shutting down debugger and killing application for 'osu_ireduce'.
$
MPI environment variables
Also see man mpi.
MPICH_OFI_CXI_COUNTER_VERBOSE
If set to a non-zero value, this enables more verbose output about the Cassini counters being collected. Can be helpful for debugging and/or identifying which counters are being collected. Only applicable to Slingshot 11.
Default: 0
MPICH_OFI_VERBOSE
If set, more verbose output will be displayed during MPI_Init to verify which libfabric provider has been selected, along with the name and address of the NIC being used. This may be helpful for debugging errors encountered during MPI_Init.
Default: not set
MPICH_OFI_NIC_VERBOSE
If set to 1, verbose information pertaining to NIC selection is printed at the start of the job. All available NIC domain names, addresses and index values are displayed. Setting this variable to 2 displays additional details, including the specific NIC each rank has been assigned, which is based on MPICH_OFI_NIC_POLICY.
Default: 0 ( delta-ai sets this to 2 for you )